LTE H-Monitor
LTE H-Monitor is a software that allows you to monitor your Huawei 4G or 5G router.
You can display indicators (speeds, signal strength, etc.) over different periods (up to 1 year), and you can also manage the router configuration (radio parameters, SMS forwarding, data activation schedules , ...).
Contents
Main features
Download and installation
Free version - Purchase a license
Program Start and Initial Setup
User interface
Detailed configuration
Customizing the graphics
Network tools
Integrated web server
FAQ
Main features
- Graphic functions :
- Graphs over 5 minutes, 1 hour, 1 day, 1 week, 1 month or 1 year
- Multiple indicators : data rates, volumes, signals, customized indicators, ...
- Fully configurable graphics (number of windows, curves, colors, formulas, ...)
- Display profiles to save several different graphic configurations
- Integrated web server to display graphics in a web browser
- Stay-on-top floatting window to display summary information
- Monitoring functions :
- Display of reception level, UL and DL bands, data quota, ...
- Scheduled restart of the router at different times
- Activation / Deactivation of data or wifi according to schedules
- Ping and DNS performance monitoring
- SMS triggers : the reception of a particular SMS activates a function (Data, Wifi, Vpn, Radio override, Restart or personalized commands)
- Display and setting of radio bands
- Possibility of forcing the radio parameters in case of change or according to schedules
- Selection of internal / external antennas
- SMS forwarding to another number or by email
- Kill switch to immediately stop data
- Direct access to the router's configuration page
- Direct access to maps with BTS positions (Anfr, Cartoradio, Cell2gps, ...)
- Direct access to the nPerf speed test
- Public IP address localization
- Emailing of data reports
- Possibility of retrieving indicators from other equipments (XML or JSON web services)
- Environment :
- Requires a compatible router (B525, B715, B818, ...)
- Works on Windows 10, Linux (Raspberry Pi, NAS Synology, with Mono), or directly on the router (embedded version)
- Graphics can be displayed in a browser on Android, iOS, Tizen, ... (integrated web server)
- Portable executable : no installation required, just place the files in the directory of your choice
- Command line mode to record indicators in console mode without graphical interface
- Several languages available (FR, EN, ...)
- The free version is limited: it does not save data when the program is closed.
- Requires a compatible router (B525, B715, B818, ...)
Download and Installation
The latest version of LTE H-Monitor can be found here : http://download.ltehmonitor.com
Windows installation
All you have to do is unzip the downloaded archive in the directory of your choice.
This directory must be writable so that LTE H-Monitor can save its configuration (Warning : by default, this is not the case for the Windows Programs directory. If you install LTE H-Monitor in this directory, you will need to change its permissions or run the program as administrator).
To automatically start the program on startup, just create a shortcut in \ProgramData\Microsoft\Windows\Start Menu\Programs\StartUp
Linux installation
LTE H-Monitor works under Linux with Mono.
sudo apt-get update
sudo apt-get install mono-complete
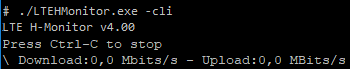
mono ./LTEHMonitor.exe -cli
If your language is not supported, you'll need to change the LANG variable :export LANG=en_GB.utf8 && mono ./LTEHMonitor.exe
crontab -e
@reboot /usr/bin/mono /YourPath/LTEHMonitor.exe -cli
For an easier start on Synology NAS, see the faq.
Embedded version (on the router)
LTE H-Monitor can run directly on the router.
The main advantage of this solution is that LTE H-Monitor works all the time, without the need to keep a PC or Raspberry Pi on. Another advantage is that the recording or visualization of data is not disturbed by CPU usage rate.
However, the embedded version does not support the following features :
- The SMS reading functions do not work (SMS forwarding, triggers).
- Some functions are not supported (embedded web server, Wi-Fi or Mobile data activation/deactivation time, etc.)
- It does not work with the free version of LTE H-Monitor
To install and use the embedded version, you have to :
- Create a directory named
hmein the root of a USB key - Unzip the archive mentioned above in the
hmedirectory - Modify your router's firmware so that the
hme/autorun.shscriptis executed when the router starts up, by adding the following lines at the end of the file/etc/autorun.sh:
busybox sleep 10
if [ -f /mnt/sdcard/*/hme/autorun.sh ]; then source /mnt/sdcard/*/hme/autorun.sh; fi - Restart the router with the USB key plugged in
- Enable Samba sharing on the router (menu Advanced / System / Sharing / Samba) to be able to access data from your PC
- To view the data on your PC, just run LTEHMonitor.exe from the Samba share (recording is done even when the PC is off).
Free version of the program - Purchase a license
The free version of the program is identical to the licensed version, with some limitations.
The main difference is that the free version does not save data. Historical data is therefore not available for consultation. The mini web server, the embedded version (on the router) and the command line operations are not available with this version. The program also stops the supervision of SMS and radio parameters after a few hours. The CLI version can be started manually but not automatically at boot time or with a script (Raspberry, NAS, ...).
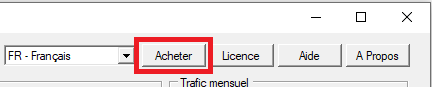
To have access to all the functions of the program, you have to purchase a license. To do this, just click on the Buy button and follow the instructions :
The license is bound to a single router. This means that you can install this software on several computers but, if you use it with a different router, you'll need another license.
Program Start and Initial Setup
Graphic mode
To start the program with the graphical interface, just run the LTEHMonitor.exe file
Command line interface (CLI)
To start the program from the command line, just add the option -cli :
The configuration and the data are kept in the same directory as the executable :
- LTEHMonitor.xml for configuration
- LTEHMonitor.dat for data
It is possible to start several instances of the program in the same place, including with a network share (samba). It is possible, for example, to start the program in command line mode (-cli) on one machine, and to view the data on another.
Running commands at startup
It is possible to ask the program to execute some commands when it is started in "Command line" mode : LTEHMonitor.exe -command=xxx
where xxx is the list of commands to be executed, separated by commas
The supported commands are :
-
RebootRouter: to restart the router -
SendSms:<Tel>:<Message>: to send the SMS<Message>to the phone number<Tel>.
For example, the command :LTEHMonitor -cli -command=SendSms:+33601234567:"Hello world !",Exit
will send the SMSHello world !to the number+33601234567
It is possible to use \ as en escape character :-
\,: To prevent a comma from being included in the message (and not interpreted as a command separator) -
\n: To insert a line break in the message -
\": To insert quotes in the message (so that they are not removed by the system shell)
For example, the command :LTEHMonitor -cli -command="SendSms:+33601234567:Hello\,\n\"world\" !",Exit
will send the following SMS :
Hello,
"world" ! -
-
ListSms: to list all the SMS -
ForceRadio: to force the previously saved radio configuration (in the graphical interface)
Optional parameters can be specified, separated by the character "-" :-
ModeAuto,Mode2G,Mode3G,Mode4G,Mode3G4G: To specify the network mode. -
NSA,SA,NSA+SA: To specify the 5G mode. -
BandsAuto: For an automatic band selection (in case they are not specified with the parameters below). -
ULx: To specify the UL band. For exampleUL7for band 7. -
DLx: To specify the DL bands. For exempleDL3-DL7for bands 3 and 7.
For exemple :-
ForceRadio: To use the parameters defined in the graphical interface. -
ForceRadio-ModeAuto: To automatically configure the radio. -
ForceRadio-Mode4G-BandsAuto: To use 4G with automatic band selection. -
ForceRadio-Mode4G-UL3-DL3-DL7: To use 4G with UL band 3 and DL band 3 and 7.
-
-
GetRadioConfig: to get the radio configuration in the form of a parameter that can be used with theForceRadiocommand.For example, this function can return :
ForceRadio-Mode4G-UL3-DL3-DL7 -
DataOnouDataOff: to activate or deactivate mobile data. -
WifiOnouWifiOff: to activate or deactivate Wifi. -
VpnOnouVpnOff: to activate or deactivate the router VPN. -
AntennaAuto,AntennaInternal,AntennaExternal, orAntennaMix: to define the use of the antennas. -
Exit: to exit the program after executing the commands. If this command is not specified, the program will continue in command line mode (-cli)
For example, to restart the router and exit the program immediately, you can use the following command : LTEHMonitor.exe -command=RebootRouter,Exit
Another example, to activate mobile data, configure the radio and antennas, and exit the program immediately : LTEHMonitor.exe -command=DataOn,ForceRadio-Mode4G-UL3-DL3-DL7,AntennaExternal,Exit
This function is not available with the free version of the program.
Command line parameters
- Start in "read only" mode :
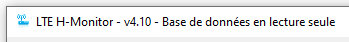
To prevent the program from modifying the database, you can add the parameter
-rodb. This parameter can be used in graphics mode or in "command line" mode.When the program is started in this mode, the title bar indicates :
This function can be useful when starting several instances of the program on the same database (for example: one on a Raspberry Pi or a Synology NAS to save the data and another one on a PC, to view the data).
In case several instances are started without this parameter, it must be ensured that the first started is also the last stopped: the program reads the database at startup and saves it periodically (configured here) and also when it is stopped. Thus, when a 2nd instance is started, the last minutes (not yet recorded by the 1st instance) may be missing. This is the reason why this 2nd instance must be stopped first.
- Database synchronization at startup :
Several instances of the program can share the same database. For example, one instance can run on a NAS or Raspberry to record data and another one can be used on a PC to view it.
The parameter
-syncallows you to ask other instances to save their database. In this way, the latest data can be viewed when the program is started. If this parameter is not used, the accessible data will be those recorded according to the automatic backup configuration.Practical example :
- On a NAS
To record the data, we will use the following command :
LTEHmonitor.exe -cli - On a PC :
To display the data, we will use the following command :
LTEHmonitor.exe -rodb -sync
- On a NAS
- Allow multiple instances on the same machine :
The default behaviour is to prevent the program from being started several times on the same machine.
The parameter
-allowmultipleinstanceschanges this behaviour and allows you to start several instances of the program on the same machine.
Initial configuration
The initial configuration must be performed by running the program in graphic mode. LTE H-Monitor needs the router credentials to get started :
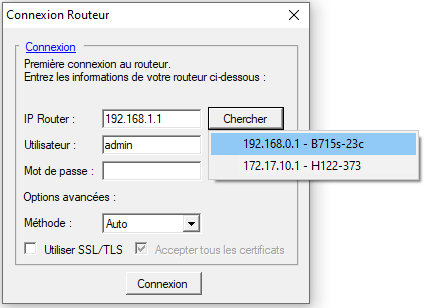
This information can also be entered in the "Configuration" tab of the program. See here for an explanation of login parameters.
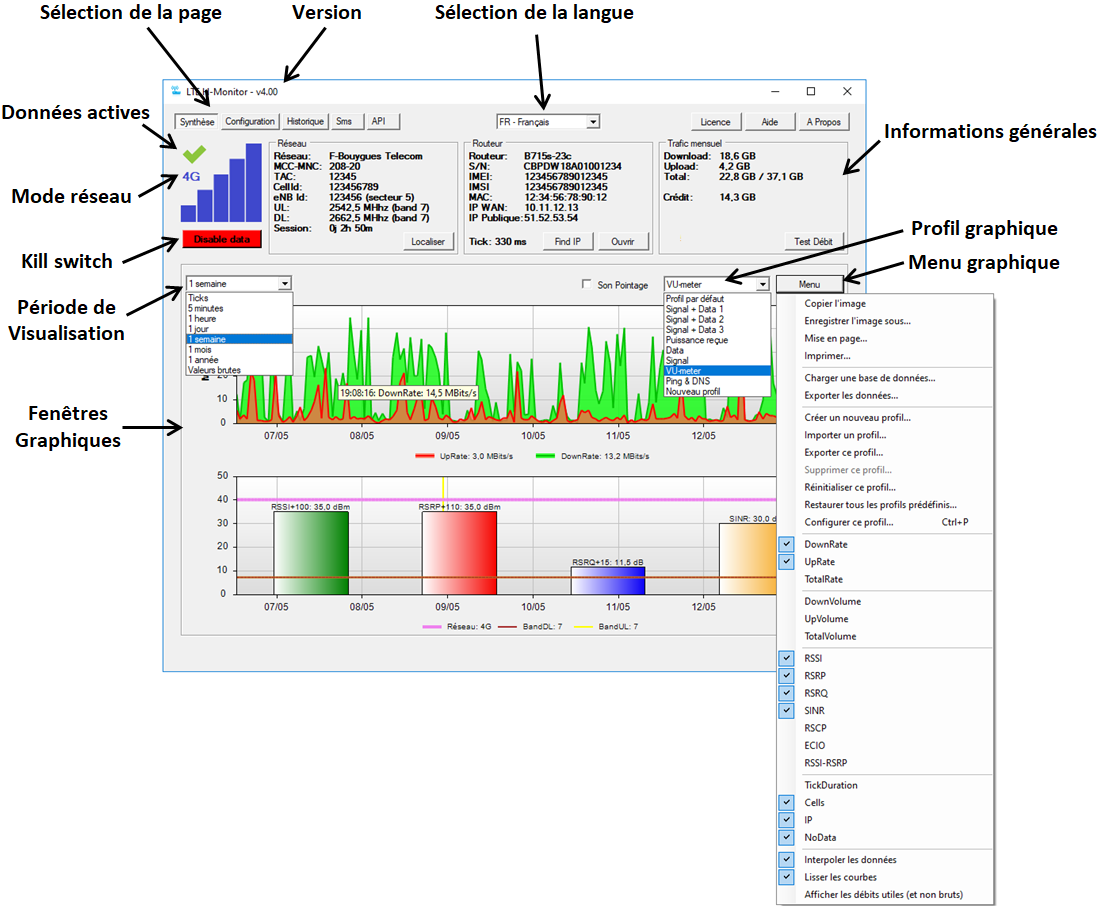
User interface
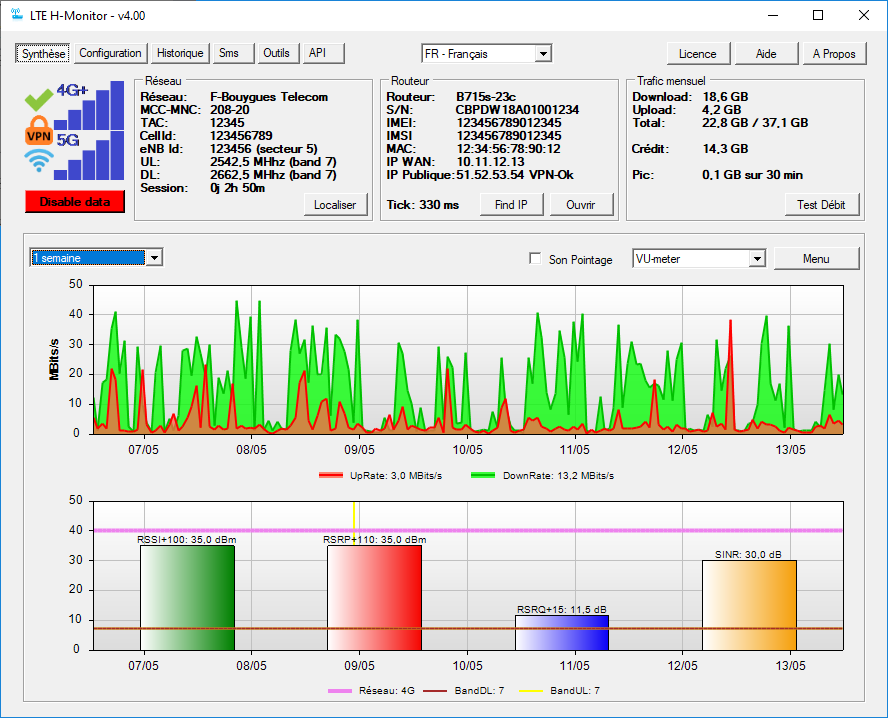
The main program screen looks like this :
Detailed configuration
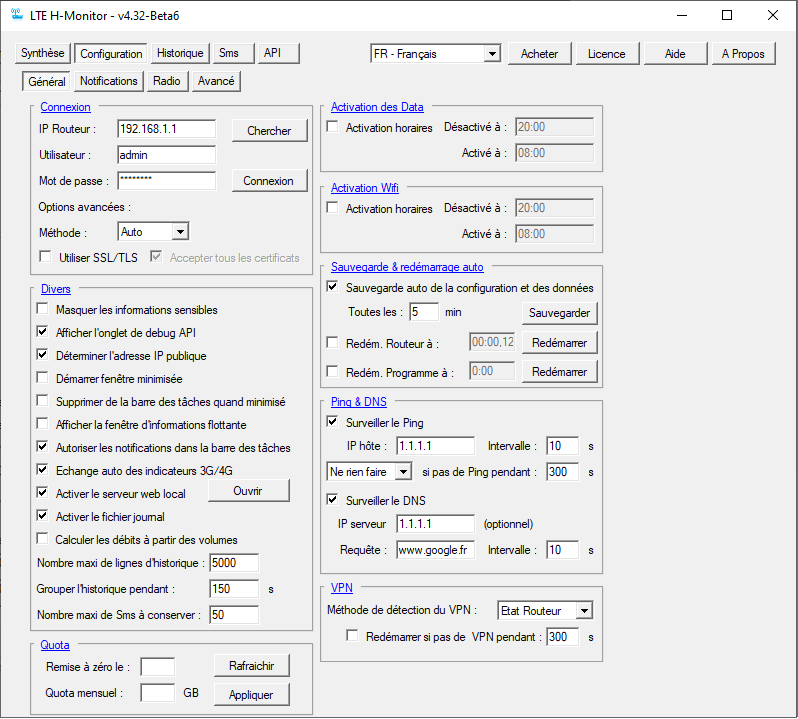
The Configuration page is displayed by clicking on the Configuration button :
It gives access to 4 configuration tabs : General, Notifications, Radio and Advanced :
General Configuration :
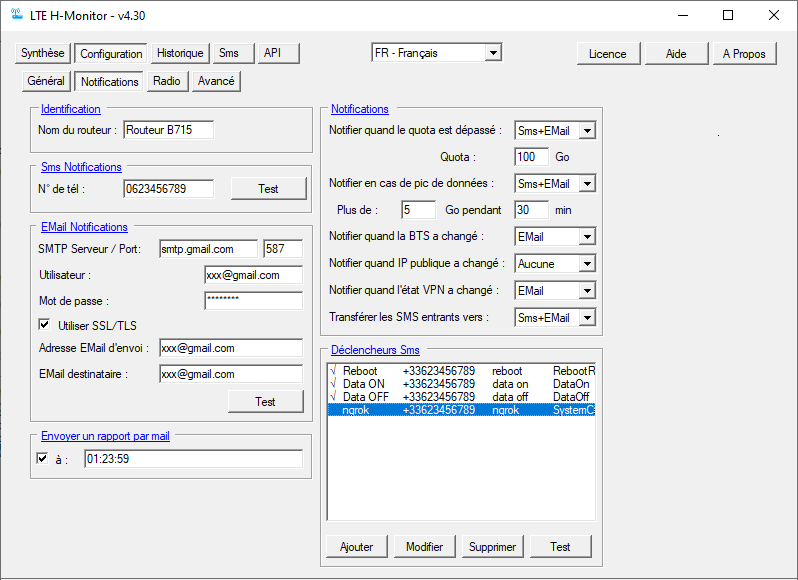
Notifications configuration :
Radio configuration :
Advanced configuration :
The
modifications made on these screens are taken into account immediately
(no need to validate anything), with the exception of the Band and
Antenna setting where you must click on the Apply corresponding button.
Login information
This is where the router connection parameters are specified: IP address, user and password :
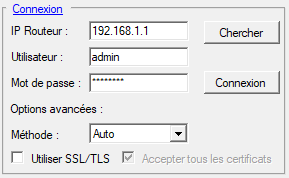
Once the information has been entered, just click on the button Connexionto verify that it works. From there, connections to the router will be made automatically.
The Method selection list allows you to choose how LTE H-Monitor connects to the router. In most cases, the default automatic mode does not need to be changed. In some cases, when the connection is not made, you can try to choose another method (API or CSRF). The API method is generally the one that works with recent firmware.
If your router requires an SSL/TLS connection, you can check the checkbox Use SSL/TLS. If its certificate is self-signed, you must check the checkbox Accept all certificates.
If the router does not use port 80, it is possible to specify the port used, after its IP address. For example : 192.168.1.1:8080
Schedules
Some LTE H-Monitor functions can be triggered on a regular basis (activation/deactivation of data, Wifi, restarting the router, forcing radio parameters, sending reports).
For each of these functions, entering a schedule can be done in one of the following forms :
-
HH:MM: The hour and minute at which the function must be triggered each day. -
J:HH:MM: The day of the week (A = Monday, ..., G: Sunday), the hour and the minute at which the function must be triggered each week. For example,C:12:30will send the report every Wednesday at 12:30 p.m. -
JJ:HH:MM: The day of the month (from 01 to 31), the hour and the minute at which the function should be triggered each month is indicated. For example,01:12:30will trigger the action every 1st of every month at 12:30 p.m. -
*:HH:MM: This format is identical toHH:MM.
For each function, you can define as many schedules as you want. Just separate them with a space or a comma.
Data activation / deactivation periods
This function allows you to set the times at which the data will be activated or deactivated :
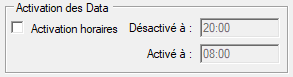
For the format specification, see the section Schedules.
Période d'activation/désactivation du Wifi
This function allows you to set the times at which Wifi will be activated or deactivated :
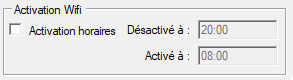
For the format specification, see the section Schedules.
Auto save and reboot
This function allows you to set the time interval between each automatic configuration and database backup.
It also allows you to set the times at which the router or the program will be restarted :
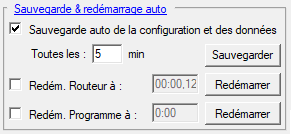
For the format specification, see the section Schedules.
Ping & DNS
The program can be configured to perform a ping and / or a DNS query at regular intervals. The results will be saved in the database and can be viewed later.
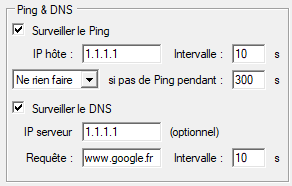
For Ping requests, you have to define the server to be tested. It is recommended to use an IP address (for example 1.1.1.1) rather than a server name (for example one.one.one.one) to avoid incorrect measurements due to DNS resolution of one.one. one.one in 1.1.1.1.
By selecting "Restart" or "Force Radio" from the drop-down list, the router will perform the requested action when the Internet is cut for the specified time.
For DNS requests, specify the DNS server (optional but recommended) as well as the name to request.
In both cases, it is indicated whether the option is activated or not, as well as the time between each request.
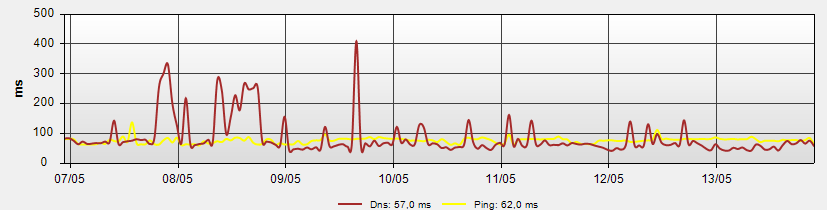
Note on DNS queries: When a DNS server is specified, the queries are not made in the cache, which gives more relevant measurements : for each new query, a DNS network packet is sent to the specified server. When the DNS server is not specified, the queries are made by the operating system and there is no guarantee that they will not be made in the cache.
When these options are activated, we can then obtain graphs of this type :
VPN
This section allows you to define how LTE H-Monitor monitors the VPN.
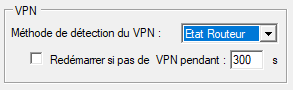
The VPN detection method is adjusted depending on the VPN you are using :
-
Disabled: if you are not using a VPN -
Router status: when using a VPN which is configured on the router. LTE H-Monitor then uses the router's APIs to determine the state of the VPN. -
DNS access: when using a VPN on your PC or on a firewall located downstream from the 4G router. To determine if the VPN is connected or not, LTE H-Monitor makes a query on the router WAN DNS server. If this server is accessible, the VPN tunnel has not been created.
When the VPN is created on the router, it is possible to schedule a restart when the VPN has not been connected for a certain time (indicated in seconds). For the router to be restarted, the VPN must be enabled on the router, but not connected.
The VPN status is displayed on the home screen :

Quota
This section allows you to define the monthly data plan quota on the router.
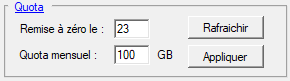
This information is the same than the one that can be configured in the router web interface.
It is used to compute the monthly traffic information that is displayed on the dashboard.
SMS
LTE H-Monitor allows you to forward all the SMS to a specific number, and also to send various notifications to this number.
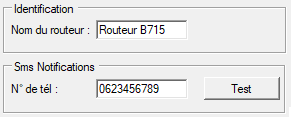
On this screen, you can specify the phone number that will receive the notifications (be careful, it is not the one of the router !). You can also specify a name for the router that will be used in the notifications.
The Test button will immediately send an SMS to the specified number.
Here we specify the parameters of the email account that will be used to send the notifications (quota reached, change of BTS, change of public IP, SMS forwarding) as well as the recipient's email address.
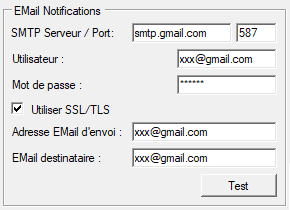
For mail services that use SSL, only the "explicit SSL" (STARTTLS) mode is supported. "Default SSL" mode is not supported.
The Test button allows you to immediately send an email to the specified address.
For those who want to use a GMail account, it is required to enable the SMTP protocol on the GMail account (Google calls it "Less secure access of applications"). It's here : https://myaccount.google.com/lesssecureapps?pli=1
Sending a report by email
LTE H-Monitor can send data reports by email.
Just activate the option below and specify the times at which the report should be sent.
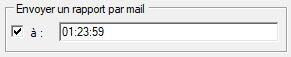
For the format specification, see the section Schedules.
Notifications
LTE H-Monitor can send several types of notification :
- When the data threshold is reached
- When a data peak is recorded during a given period
- When the BTS to which the router is connected changes
- When the public IP address of the router changes
- When the VPN state changes
- When an SMS is received, it can be forwarded
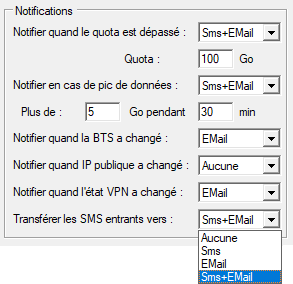
For each of these notifications, you can choose the action that will be performed :
-
None: No notification is sent -
Sms: The notification is sent to the number indicated in the SMS settings -
EMail: An email is sent to the address indicated in the EMails settings -
Sms+EMail: Both actions are performed
SMS triggers
With LTE H-Monitor, it is possible to trigger an action when a particular SMS is received.
For example, you can reboot the router, deactivate or activate the data, force the radio parameters, issue an HTTP request or execute a system command.
You can define as many triggers as you want. They are listed in the "SMS Triggers" section :
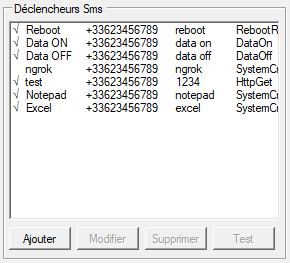
Use the Add, Modify, and Delete buttons to manage the list of triggers. The Test button can be used to test an action without the need to wait for the corresponding SMS.
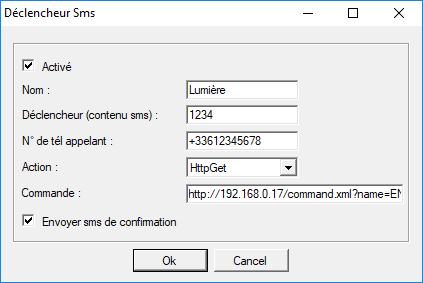
The configuration of each trigger is done as follows :
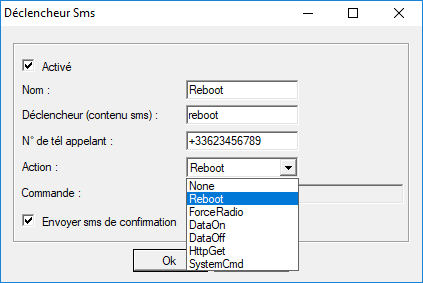
- The trigger can be enabled or disabled with the
Enabledbutton - We define a name that will be used in the list of triggers
- The sms content is what needs to be sent to activate this trigger. Only the beginning of the SMS is taken into account. Thus, a trigger having been configured with the content "reboot" will be activated when an SMS beginning with "reboot" or "reboot router" is received. Be careful with lowercase / uppercase letters which are taken into account : an SMS beginning with "Reboot" will not activate this trigger.
- We specify the telephone number that is authorized to send this trigger, as it is received by the router (generally in the international format +33 for France). This number is optional. If no number is specified, any sender can activate this trigger. For security reasons, it is therefore recommended to provide a phone number.
- The drop-down list allows you to select the action that will be performed by this trigger :
-
None: the trigger will do nothing. -
ForceRadio: the radio parameters will be sent to the router. This can be useful if the connection is lost. -
DataOn: the data will be activated. -
DataOff: the data will be deactivated. -
HttpGet: The HTTP request indicated below will be queried. -
SystemCmd: The system command indicated below will be launched. -
WifiOn: Wifi will be activated. -
WifiOn: Wifi will be deactivated. -
VpnOff: The VPN will be activated. -
VpnOff: The VPN will be deactivated.
-
- When
Send acknowledge SMSis checked, an SMS will be sent to acknowledge receipt.
Example : Using a HttpGet trigger with a Yokis light module. In this example, a light module called LIGHT is paired with the Yokis gateway 192.168.0.17, and we want to activate this module by sending an SMS beginning with "1234".
The following parameters are used :
- Box
Enabledchecked - Action :
HttpGet - Command : http://192.168.0.17/command.xml?name=ENTREE&action=default
Another example :
Another interesting use is the activation of external access via ngrok : an SMS allows you to launch the command ngrok to open a tunnel accessible from the outside.
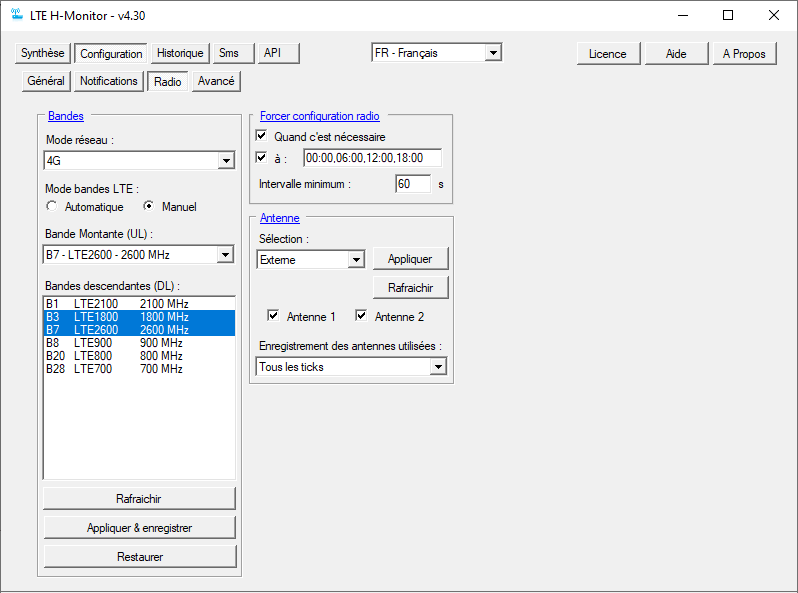
Band configuration
This section is used to view and define the radio settings.
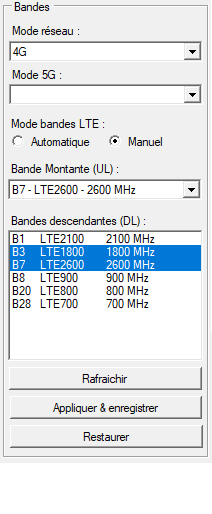
You can choose the network mode : 2G, 3G, 4G, 3G+4G auto
LTE band management can be automatic or manual. In manual mode, you can choose the uplink band (UL, Upload) and the downlink bands (DL, Download). To do 4G + aggregation, you must select multiple DL bands.
Only the bands available on the router are displayed.
Once the band configuration has been done, send it to the router by clicking on the Apply & Save button. The saved configuration can be restored with the Restore button will also be the one used with force radio configuration.
The Refresh button is used to read the configuration of the bands in the router and display it in LTE H-Monitor. This action is done automatically when connecting to the router. It
is useful to click on this button when the band configuration may have
been changed by another software or in the router's web interface.
The Restore allows you to reapply the last configuration that was saved.
Force radio configuration
This function makes it possible to reapply the radio parameters automatically. This can be useful for periodically restarting a session or when the router itself changes bands.
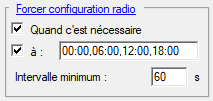
-
When needed: LTE H-Monitor monitors the radio parameters and, in case of modification, readjust them according to the last applied band configuration. -
It is also possible to define times at which LTE H-Monitor will force the last band configuration applied to the router.
For the format specification, see the section Schedules. - To prevent too many back and forth changes, it is possible to define the
Minimum interval delaybetween each change. So, when a modification is detected, the configuration is applied immediately, but the next change will have to honor this delay. The minimum value is 60 seconds.
Antennas selection
In this section, you can choose the antennas to use : Auto, External, Internal, Mix.
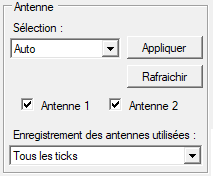
The 2 check boxes indicate which antennas are connected
Once the antennas to be used have been selected, the configuration must be applied to the router by clicking on the Apply button.
The Refresh is used to read the current configuration in the router and display it LTE H-Monitor. This action is done automatically when connecting to the router. It
is useful to click on this button when the antenna configuration is changed by another software or in the router's web interface.
It is possible to permanently record the state of the antennas (internal / external) and to display it on a graph. As this consumes CPU time, this function is not enabled by default. You must choose the recording frequency in the selection list (None, Every 30s, Every Tick)
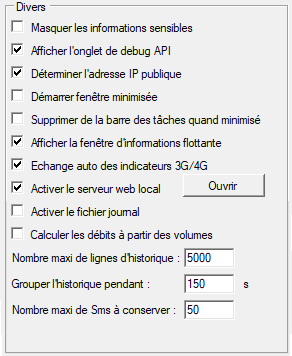
Miscellaneous
This section groups together several operating parameters :
-
Hide sensitive information: This function allows you to hide information such as IMEI, IMSI, MAC address, ... in LTE H-Monitor. This is useful for making screenshots that you want to post on the Internet. Warning: the information in the history is not hidden. -
Show API debug page: This enables the API tab. This tab is used to display low level information from the router. This function is mainly used in case of problem (debug). -
Get public IP address: This option allows LTE H-Monitor to determine the public IP address of the router. This makes it possible to monitor changes of this address, display them and send notifications about them. If this option is disabled, it will not be possible to display information related to the public IP address (main screen, graphics, history, notifications). -
Start minimized: This option lets you start LTE H-Monitor in the taskbar, without the main window opening. It is of course always possible to display the main window by clicking on the icon in the taskbar (if the following option is not activated) or in the notification area of the taskbar.
-
Hide from taskbar when minimized: This option allows you to hide the LTE H-Monitor icon in the taskbar when the window is minimized. Only the icon in the notification area will be visible. On the screen below, the taskbar icon is highlighted in orange and the notification area icon is in yellow.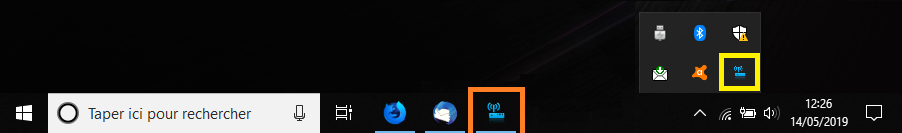
-
Display floatting info window: This option is used to display summary information on indicators in a window that is always visible. The indicators to be displayed are chosen in the profile configuration :
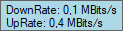
This information window can be placed anywhere on the screen. -
Auto swap 3G/4G indicators: In 4G, the RSRP and SINR indicators are used while in 3G, the RSCP and ECIO indicators replace them. This option is used to automatically switch the indicators in the graphs when the network mode is changed. -
Enable local web server: This option enables the local web server to be activated. When it is activated, you can connect to the page http://127.0.0.1:8080 (the Open button opens this page) on your PC, or http://AdresseIP:8080 on another machine ( IPaddress is to be replaced by the IP address of the machine running LTE H-Monitor).
It is possible to change port 8080 by modifying the following line in the LTEHMonitor.xml file with a text editor :<WebServerPort>8080</WebServerPort> -
Enable log file: This option enables the recording of debug messages in the fileLTEHMonitor.log. This option is only used for maintenance purposes. Be careful, this file can grow quickly. You can delete it at any time without having to stop / restart LTE H-Monitor. -
Compute rates from volumes: Some routers (E5186) do not return information about realtime data rates (Mb/s). When this option is enabled, this information will be calculated from the cumulative consumption volumes (derivation). Use this option only if realtime data rates are not displayed. -
Max number of events to keep: This option is used to limit the number of lines kept in the history. The higher this number, the larger the database (LTEHMonitor.dat). It is recommended not to exceed 5000 for this value. -
Group events generated during: This parameter is used to group together identical events in the history that occur during the specified time. To disable grouping, just use the value 0. -
Max number of SMS to keep: This parameter allows you to specify the maximum number of SMS to keep in the router. When this number is reached, the oldest are deleted.
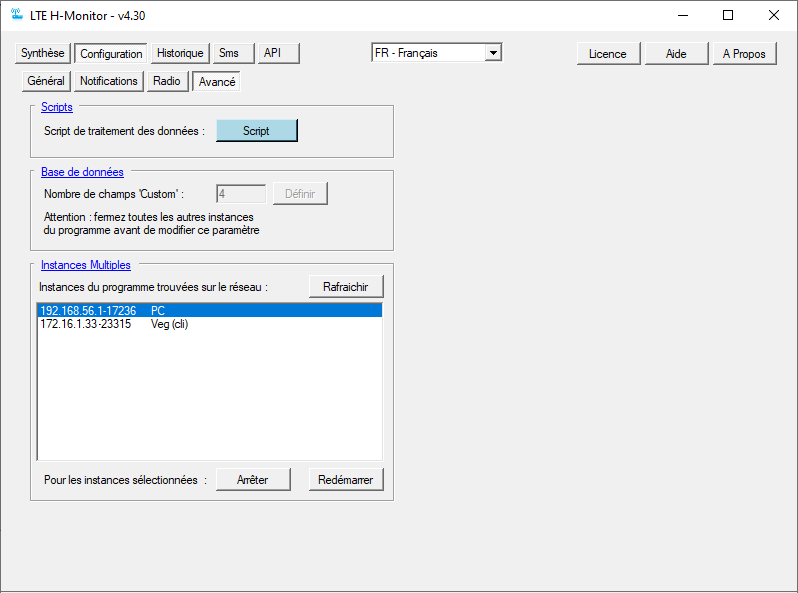
Advanced configuration
- Data processing script / Data retrieval from other equipments :
This script is used to modify or define the data which is about to be recorded in the database and displayed. It can be used to modify the data managed by the software, but also to add new data from other equipments.
This script must be written in C#.
For example, if you want to detect a correlation between your radio indicators and outdoor temperature or rainfall, you can use this script to retrieve data from a weather station.
The variable
The variables you can use are listed in the drop-down list at the top right of the screen.ycontains the structure of the data to be recorded in the database (sample N). The variabley1contains the last data that was recorded (sample N-1). The variableTickcontains a number that is incremented on each call.
For example, if you want to modify the RSSI indicator by adding 5dBm to it, just define the script as follows :
y.Rssi = y.Rssi + 5;
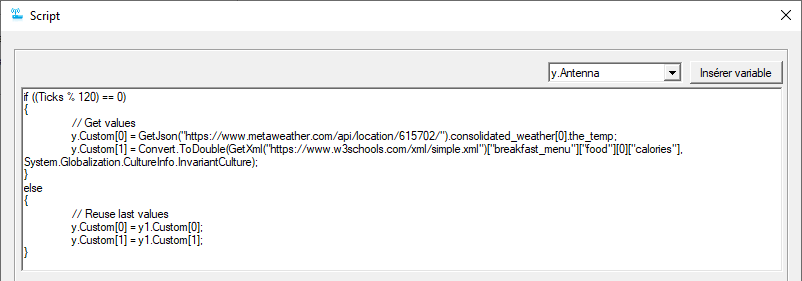
To retrieve data from other equipments, you can use the predefined functionsGetJson(Url)andGetXml(Url): In this example, JSON data is retrieved every 120 ticks from the MetaWeather site and XML data is downloaded from W3School.
    if ((Ticks % 120) == 0)

            {

	        // Get values

	        y.Custom[0] = GetJson("https://www.metaweather.com/api/location/615702/").consolidated_weather[0].the_temp;

	        y.Custom[1] = Convert.ToDouble(GetXml("https://www.w3schools.com/xml/simple.xml")["breakfast_menu"]["food"][0]["calories"], System.Globalization.CultureInfo.InvariantCulture);

    }

    else

    {

	        // Reuse last values

	        y.Custom[0] = y1.Custom[0];

	        y.Custom[1] = y1.Custom[1];

    }
This script should not be confused with those used for displaying indicators. The display scripts allow you to modify the way the indicators are displayed, while the data processing script allows you to add or modify values stored in the database.
- Definition of the number of custom fields (variables
Custom[]) :
Custom variables can be used to record indicators in the database from a processing script (see above). These variables are stored in an array (Custom[]) whose size can be set here. By default, its size is 1 element. It is possible to increase this size up to 20.
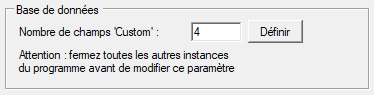
For example, when setting this number to 4, it is possible to use variabley.Custom[0],y.Custom[1],y.Custom[2], andy.Custom[3]in all scripts.
Changing this setting changes the size of the database. It is imperative that the other instances of the program are closed before you modify it (Raspberry, NAS Synology, ...).
Please note that if you are using the embedded version, this parameter must remain at 0. The embedded version is not compatible with this function.
- Multiples instances :
When using several instances of the program on different machines (Raspberry, NAS, PC, ...), they can be displayed in the list by clicking on the
Refreshbutton. The information displayed are the IP address of the instance, the process number and the name of the machine.
You can then stop or restart an instance by selecting it in the list and clicking on theStoporRestartbuttons.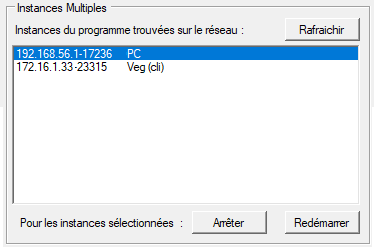
Note : the embedded version of LTE H-Monitor cannot be managed with this function.
Customizing the Graphics
LTE H-Monitor allows you to configure your graphics as desired. The predefined profiles are already quite complete and it is not compulsory to configure anything here. It is simply a feature that is available !
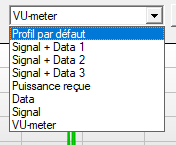
Overview
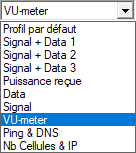
Several profiles are predefined and you can select the one you want to use from a drop-down list :
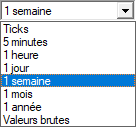
You can also choose the data span :
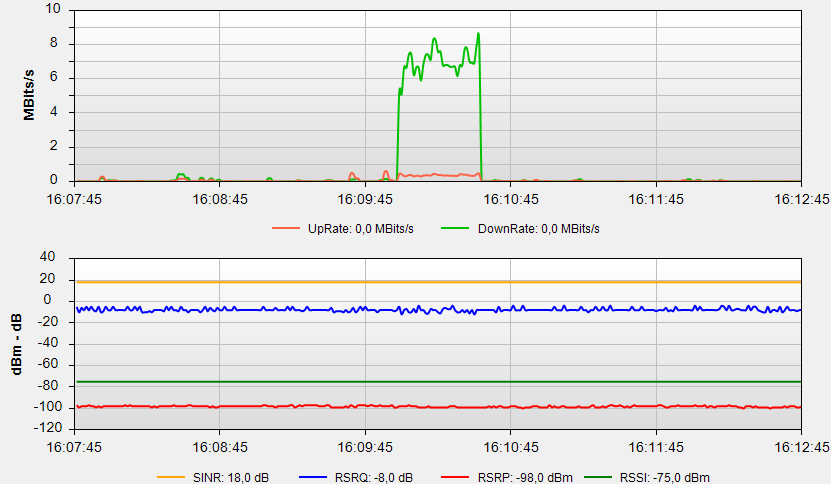
Example of a very simple profile that uses one window for data and another on for signal indicators :
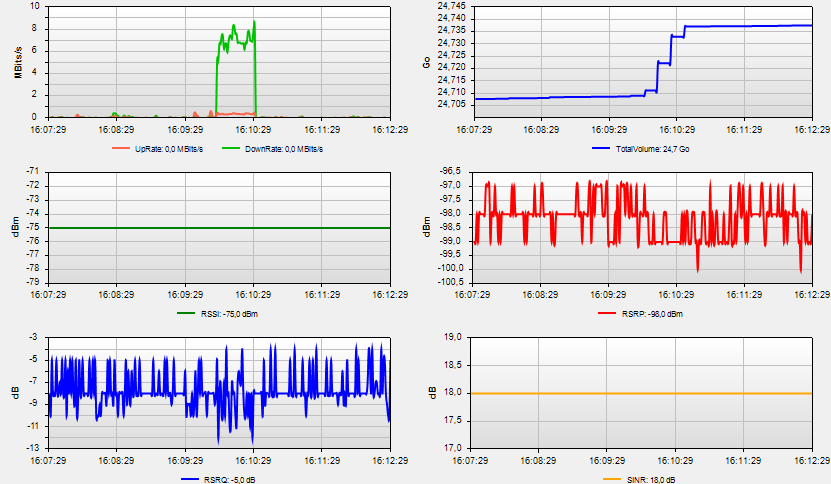
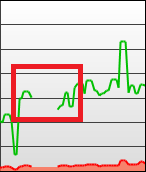
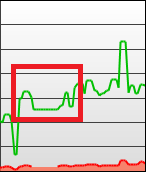
You can define up to 9 different windows and choose which information to display. For example, here, we have 6 windows :
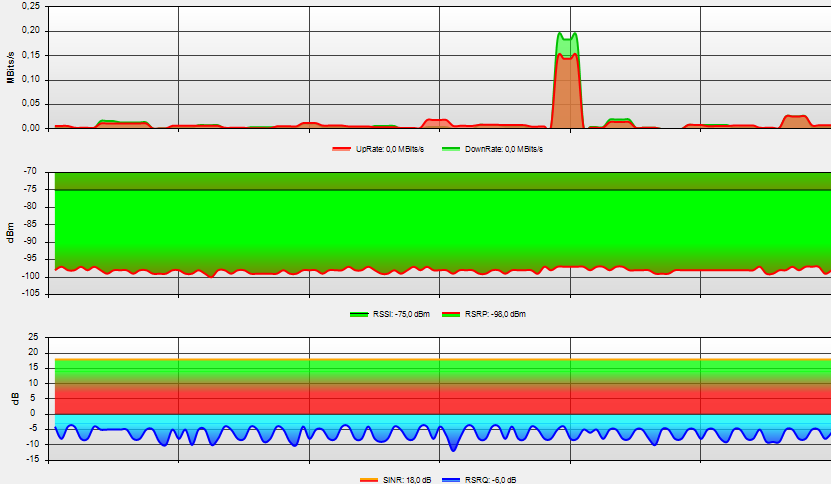
The fill color of the curves can be chosen. You can even define color gradients and choose the color change thresholds :
The configuration possibilities do not stop there. You can define your own formulas for displaying data !
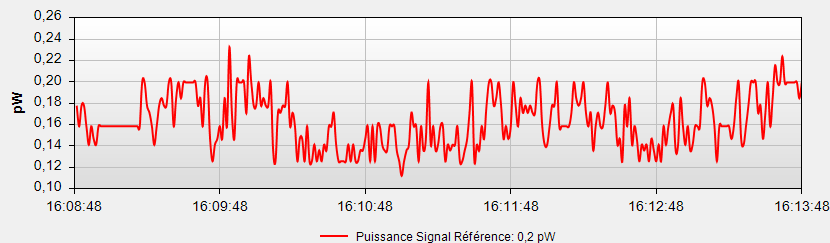
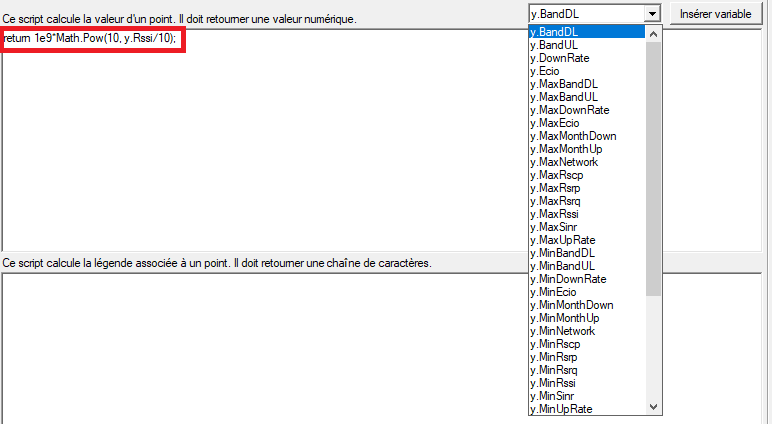
The "Puissance reçue" ("Received Power") profile is an example where RSSI and RSRP are not displayed in dBm, but in picoWatts.
To do this, the value to display for the RSSI has been defined (in the 'scripts' configuration) with the following formula :
return 1e9 * Math.Pow(10, y.Rssi/10)
We simply applied the formula for converting to milliWatts, then multiplied by 109 to have it in picoWatts. And here is the result :
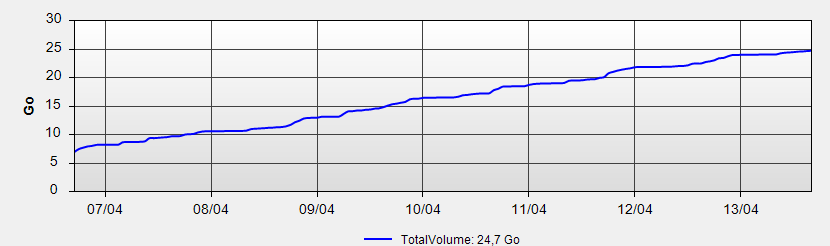
It is also possible to represent the volume of data exchanged over different periods. Here, it's over 1 week :
Indicators can also be displayed as level meters. For each indicator, you can decide to view it as a level meter and choose in which window it is displayed. We can of course display the same indicator as a curve, at the same time, in the same window or in a different one :
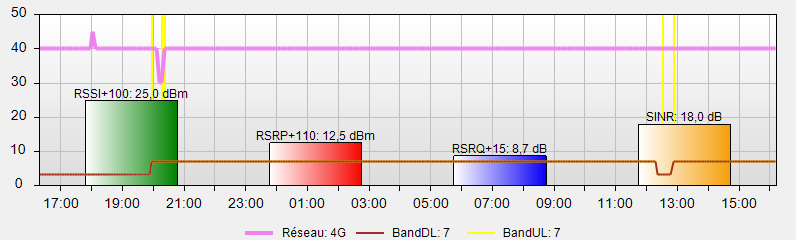
We can also see on the image above that we can display the history of band changes and network type (2g, 3g, 4g, 4g+). This is handy for seeing what happened afterwards.
The same can be done with WAN IP address changes (yellow vertical lines), BTS changes (red vertical lines) and periods without data (software stopped, router overloaded that no longer sends data - horizontal lines gray). Of course, these colors are configurable.
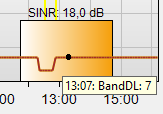
Each curve has information bubbles. By hovering the mouse over, you will get information for a specific point :
Graphics menu
Profiles are configured with the graphics menu
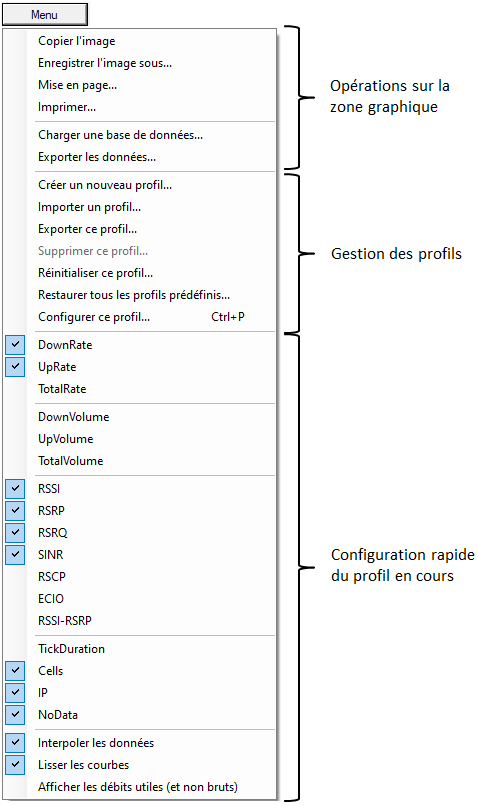
This menu has 3 main parts :
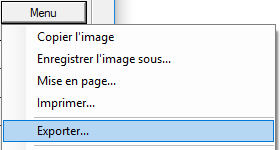
- Operations on the graphic area that allow you to export the image of the graphics window, to print it or export the data in TAB-separator format (which can be opened directly with Excel - See the FAQ)
- Profile management functions
- Configuration shortcuts for the current profile : selection of indicators to display, interpolation and smoothing of curves
Profile management
A graphic profile contains all of the graphic configuration : number of windows, indicators displayed, colors, gradients, name of curves, units, ... By changing the graphic profile, the display is completely reconfigured with just one click !
The program comes with several predefined profiles. You can also add your own customized profiles (up to 50 profiles in total).
The profile management functions in the graphic menu are :
-
Create new profile: a new profile is created from the current profile -
Import profile: a new profile is created from an XML file generated from the function'Export this profile' -
Export this profile: an XML file is created. It contains the complete configuration of this profile. -
Delete this profile: the current profile is deleted. -
Reset this profile: the original configuration is restored. In the event of an error in modifying a profile, this function allows you to find the original profile (supplied with the program). Please note that, if you have created a custom profile, this function will delete all your modifications : the profile will return to its initial state (when you have copied it from a predefined profile). -
Reset all predefined profiles: this function is useful when updating the program. It allows you to apply the profiles of the new version to the predefined profiles that already exist in your configuration. -
Configure this profile: This function is used to display the detailed configuration page of a profile. This function can also be accessed by using the key combinationControl-P.
Configuring a Profile
The configuration of a profile looks like this :
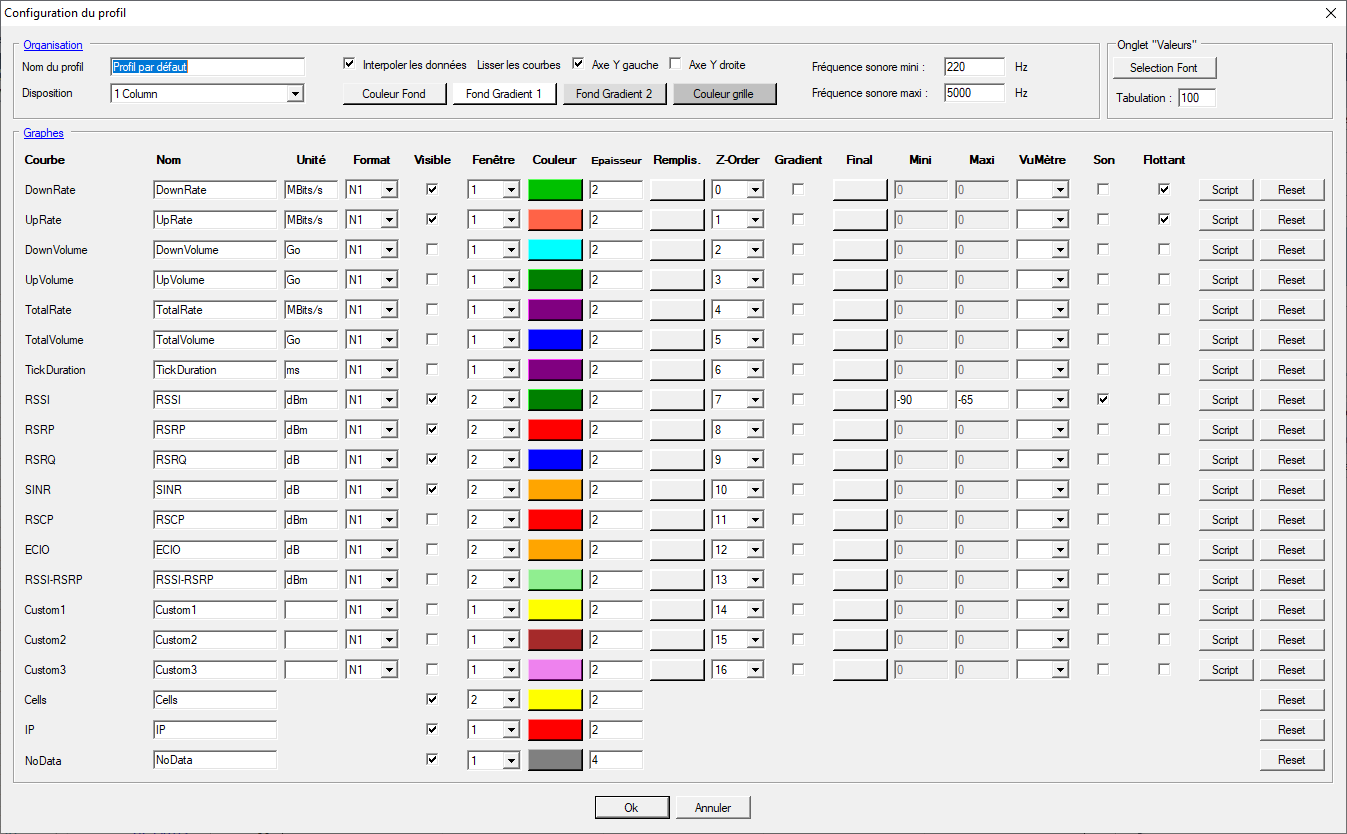
This screen has 2 parts :
- The upper part which is used to define general information : layout of the windows, color of the grid, of the background, ...
- The lower part which allows to configure the displayed curves : there is 1 line per curve
General information :
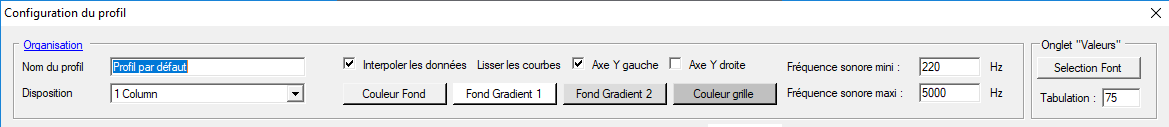
On this screen, you can configure :
- The name of the profile that will be used in the profile list.
- The arrangement of the windows (the number of windows is automatically determined according to the curves configured).
- Data interpolation and curve smoothing: data interpolation is used to fill in areas where data is missing. Note that the smoothing of the curves necessarily involves the interpolation of the data.
- Which vertical axis you want to display (left and/or right).
- The background color of the graphics area (
Back color). - The background colors of each graph (
Panel color 1etPanel color 2). You can specify 2 colors to obtain a gradient. If you want a solid color, just select the same color twice.
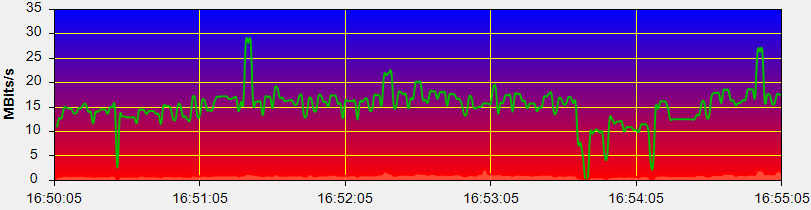
For example, by selecting the following colors :
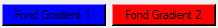
You will get a display like this :
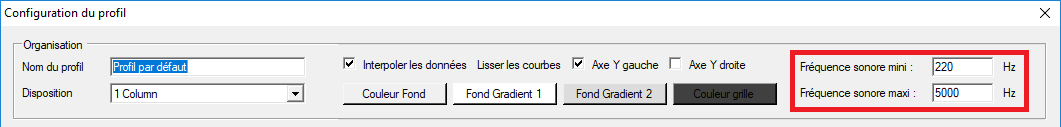
- The color of the grid (
Grid color). - The minimum and maximum sound frequencies will be used for the minimum and maximum values of the sound level indicator. For example, if RSSI is used as a sound indicator with min/max values of -90dB/-65dB, and min/max frequencies are 220Hz/5000Hz, then LTE H-Monitor will use 220Hz sound for RSSI of -90dB and a sound of 5000Hz for an RSSI of -65dB. Intermediate values are calculated by the program.
Display without interpolation :
Display with interpolation :
Display with smoothing :
Parameters for a curve :
Each line corresponds to a curve which can be displayed in a graphics window :

By default, each of these curves is pre-configured for a particular indicator, but you can rename the curve, change its unit, ..., and its calculation formula (script).
The available options for each curve are are :
- The name and unit will be used in the legend.
- The format specifies the number of digits after the decimal point. For example, to display an RSSI in the form
-70.5 dB, you have to use the format
N1. To display -70 dB, use the formatN0. - The checkbox
Visiblespecifies whether this curve is displayed or not. - The list
Windowis used to specify in which window this curve will be displayed. You can use up to 9 different windows. - The
Colorbutton and theWidthfield are used to select the color and the thickness of the curve. -
The
Fillbutton is used to select the fill color of the curve. If the optionGradientis checked, a gradient will be created between these 2 colors, taking into account the values specified in theMinandMaxfields. - The
Z-Orderlist allows you to define in which order the different curves will be drawn (0 first). If one curve overlaps another (with possible fill), the order in which they are drawn is important. - The
VuMeterlist can be used to select the window in which this indicator will be displayed as a level meter. - The
Soundcheck box defines whether this flag is used for the sound pointing of the antenna. - The
Floatcheck box defines whether this indicator is displayed in the floating information window. - The
Resetbutton is used to restore the parameters of a line as they were when entering the profile configuration. - The
Scriptbutton is used to define a customized indicator. It is colored when a script has been defined. This function is explained below.
Using Scripts :
Finer settings can be made with 'scripts'. They allow access to all the information in the database and add indicators, such as the received power or anything you can imagine.
You can also define a script to display the legend. This is useful if you want to display "text" information from digital information (such as the type of a network: 2G, 3G, ..., 4G+).
In this example, we transform dBm into pW using the following script :
return 1e9 * Math.Pow(10, y.Rssi/10)
To define it, we click on the Script button :
And here, we display the type of network in the form of text :
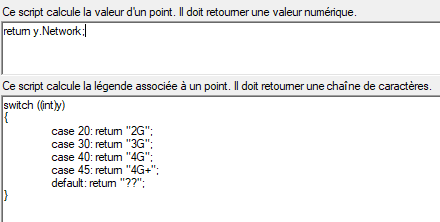
The syntax to be used in scripts is C#.
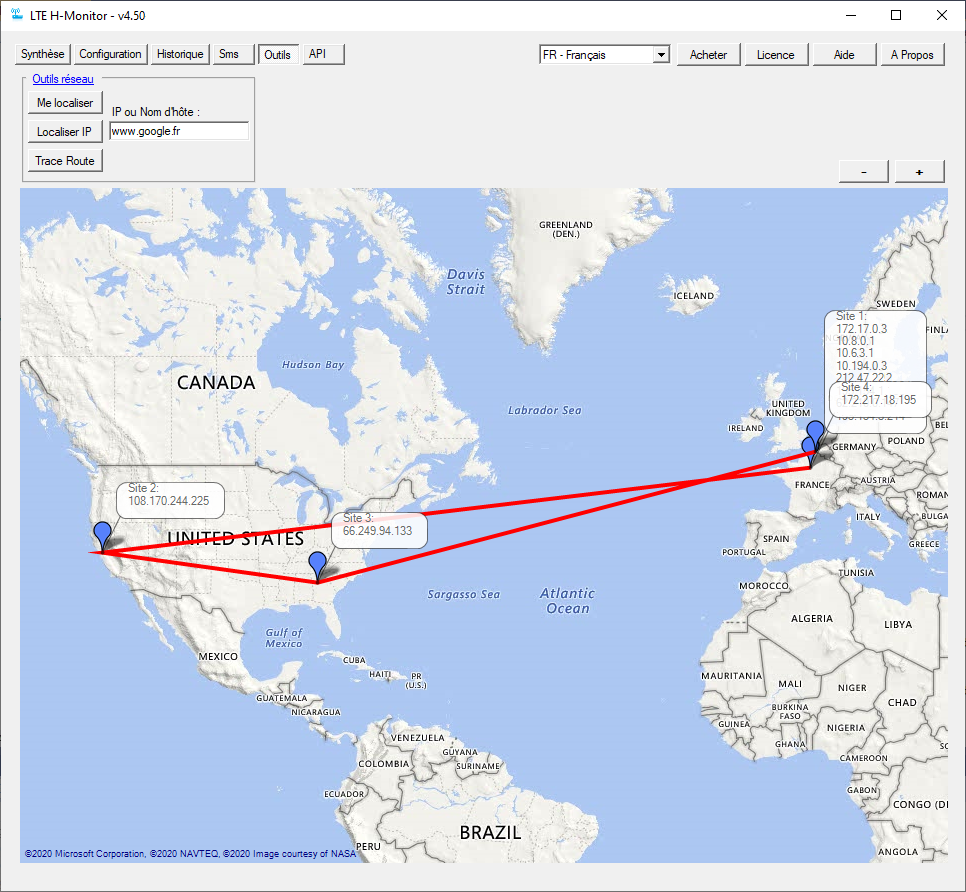
Network tools
These tools allow you to locate an ip address or a host and to trace a route (traceroute).
They are only available on Windows.
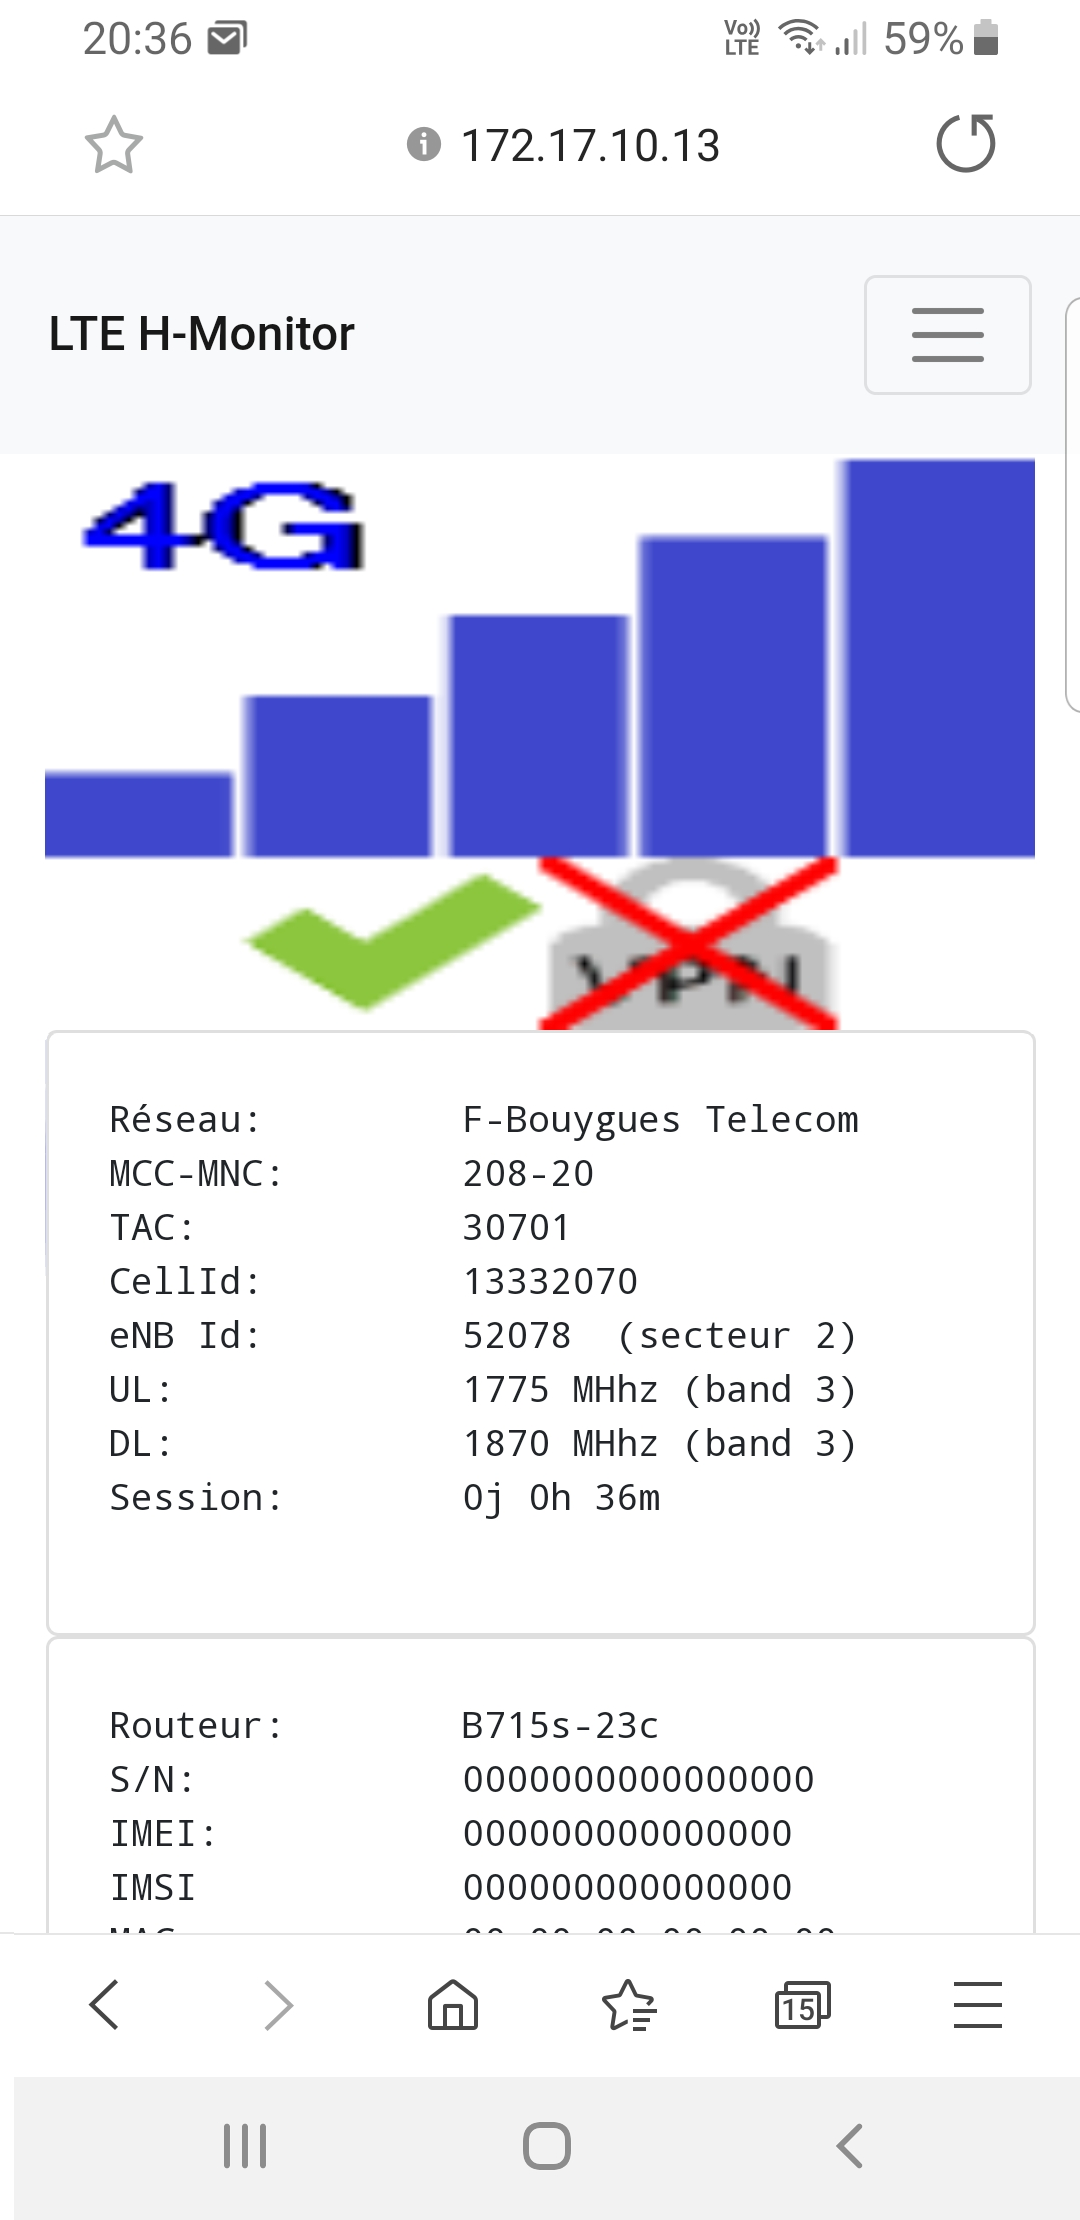
Web Server
LTE H-Monitor integrates a mini web server. It allows you to view information and graphics in a web browser, on your PC or on your phone (Android, iOS, etc.).
By default, the web server is not enabled. You must check the box Enable local web server in the configuration tab. Windows firewall may request permission to open the port used by the web server.
Even if this server only allows the display of router data (and not its configuration), be careful that it is not secure : no password is needed to access it. And it does not use SSL connection. It is therefore advisable to use it only on your private local network.
When the server is activated, you can connect to the page http://127.0.0.1:8080 on your PC, or http://AdresseIP:8080 on another machine ( IP address must be replaced by the IP address of the machine running LTE H-Monitor). It is possible to change port 8080 by modifying the following line in the LTEHMonitor.xml file with a text editor : <WebServerPort>8080</WebServerPort>
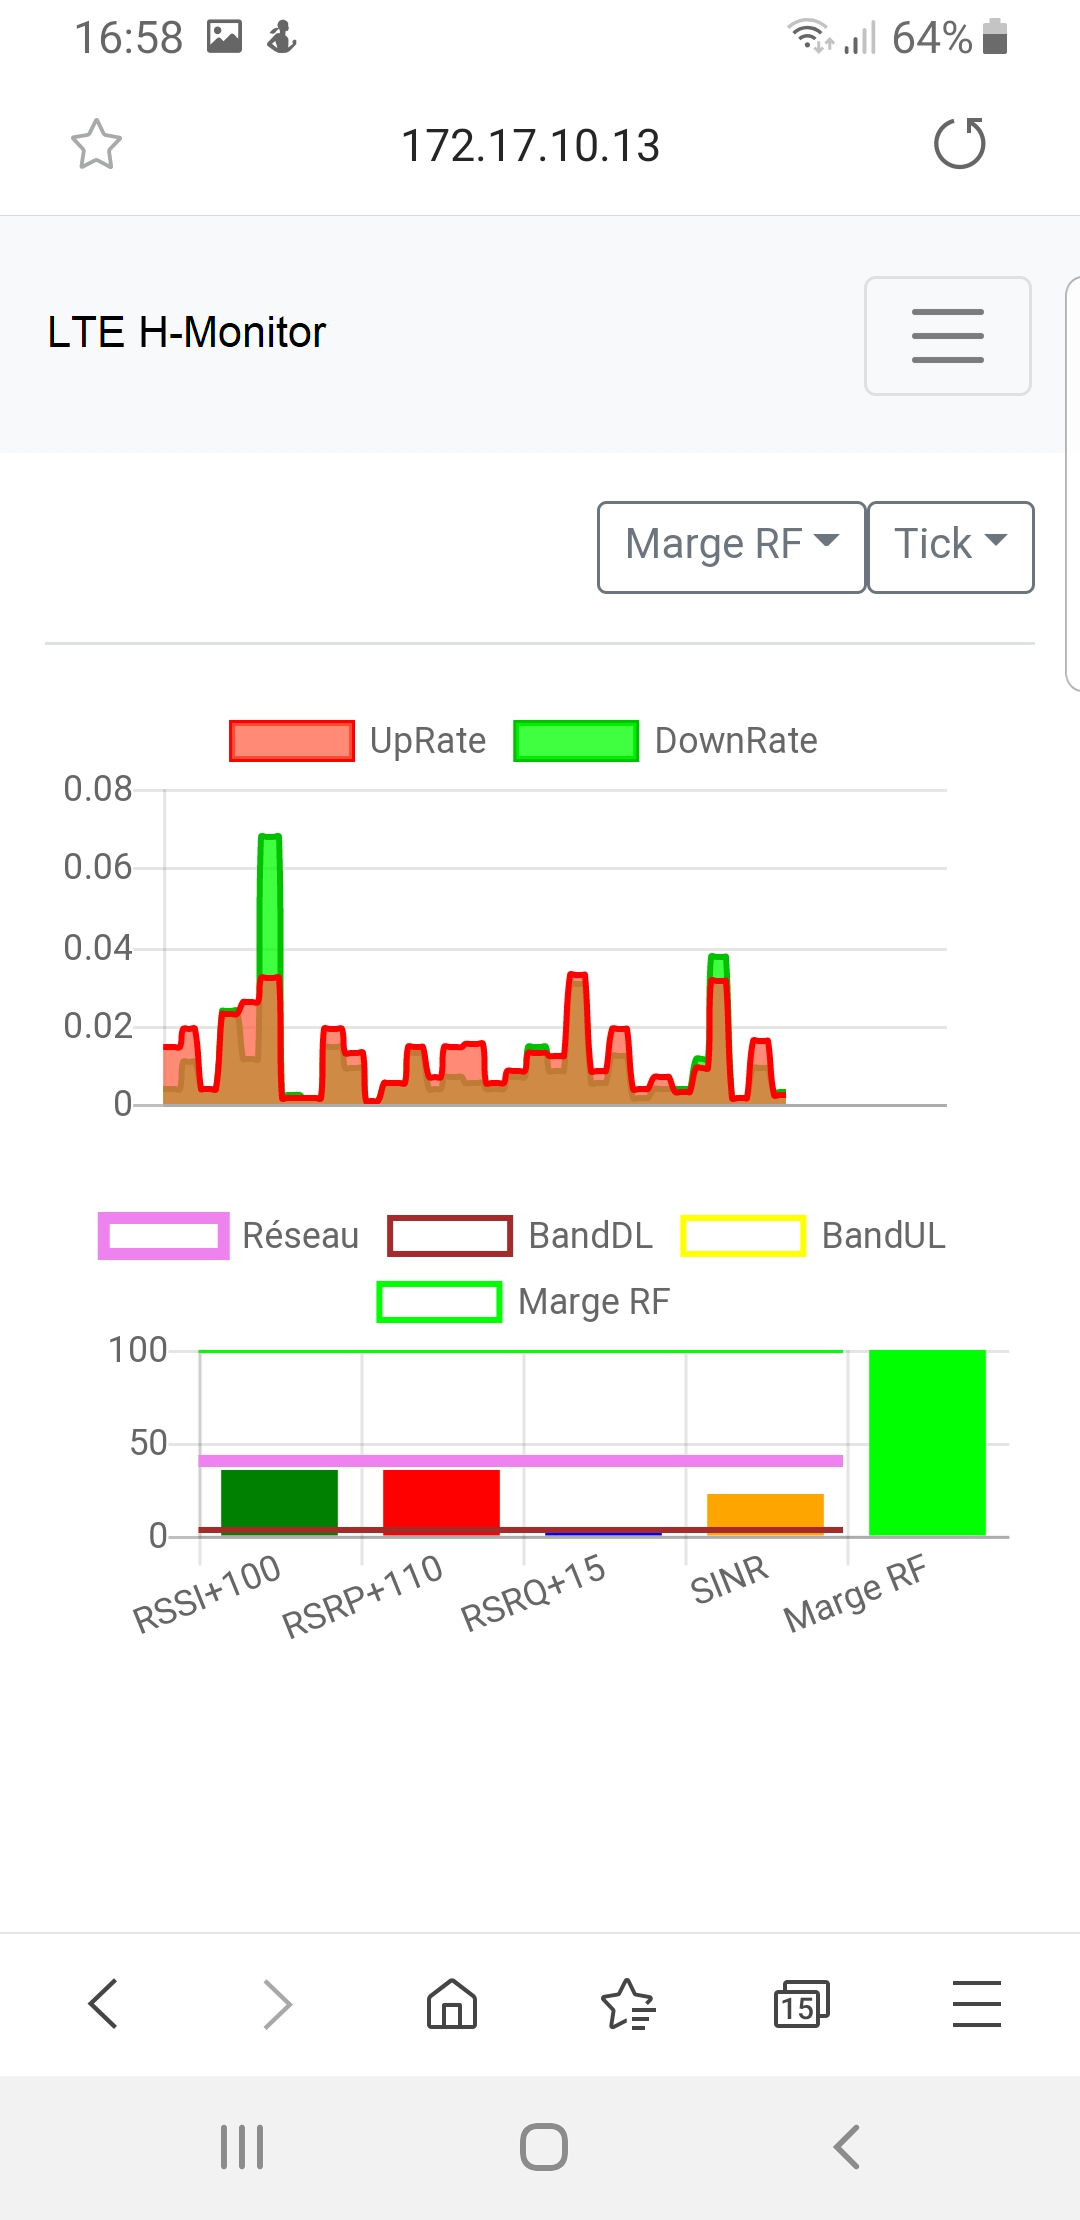
On a phone, you will get the following page :
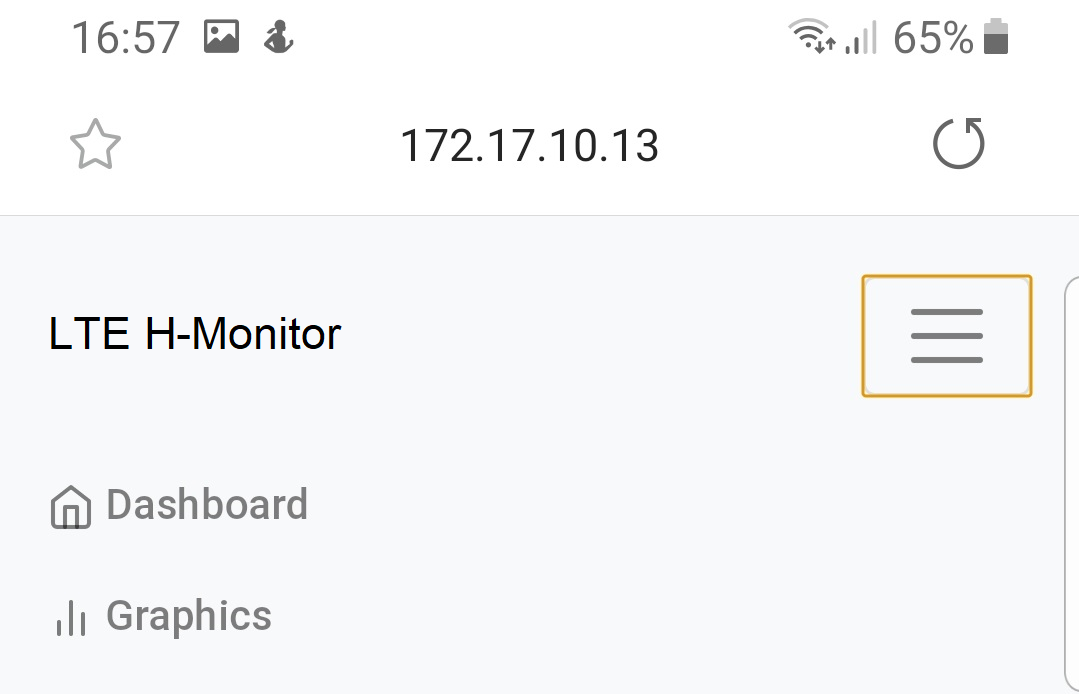
And by clicking on the menu icon, the available functions are listed :
The graph display allows you to select the profile and the data display period :
FAQ
The latest version of LTE H-Monitor can be found here : http://download.ltehmonitor.com
LTE H-Monitor works with Mono on Linux. See here.
This is the difference between the consumed volume and the quota (entered on the router), prorated at that precise moment.
For example, if the consumption is 48GB on a monthly quota of 100GB, it will indicate, in the middle of the period, " Credit: 2GB" (the prorated quota in the middle of the period is 100GB/2 = 50GB which gives a credit of 50GB-48GB=2GB ).
This lets you know at any time whether you are ahead or behind your quota.
By default, the displayed rate is the raw rate. It corresponds to the one used by the operator to calculate the volume of consumed data (volume = speed * time) and it includes the data used by the network protocols in addition to the payload.
LTE H-Monitor can display the useful rate : just check the option "Display payload (and not raw) rates" in the graphic menu.
Audible pointing makes it possible to "visualize" an indicator (RSSI, received power, etc.) in the form of a sound whose tone varies according to the level. This facilitates pointing since you simply have to point the antenna in such a way that the sound is as high-pitched as possible.
To use sound pointing :
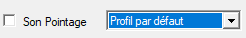
- Select the profile displaying the desired indicator (for example: Default profile , Received power or Vu-Meter for the RSSI):
- If you want to check which indicator is associated with the audible pointing for a profile, type Control-P to display its configuration. The indicator used is the one whose "Sound" column is checked. For the Default Profile, it is the RSSI :
- Activate the sound pointing by checking the corresponding box on the main screen :
-
You should now hear a sound whose pitch depends on the level of the meter. If this is not the case, make sure that the sound settings of your PC are correct (sound activated, volume, ...)
-
If you want to change the tone of the sound, adjust the profile configuration :
 The minimum and maximum sound frequencies will be used for the minimum and maximum values of the sound level indicator. For
example, if RSSI is used as an audible indicator with min/max values
of -90dB/-65dB, and min/max frequencies are 220Hz/5000Hz, then
LTE H-Monitor will use 220Hz sound for RSSI of -90dB and a sound of
5000Hz for an RSSI of -65dB. Intermediate values are calculated by the program.
The minimum and maximum sound frequencies will be used for the minimum and maximum values of the sound level indicator. For
example, if RSSI is used as an audible indicator with min/max values
of -90dB/-65dB, and min/max frequencies are 220Hz/5000Hz, then
LTE H-Monitor will use 220Hz sound for RSSI of -90dB and a sound of
5000Hz for an RSSI of -65dB. Intermediate values are calculated by the program.

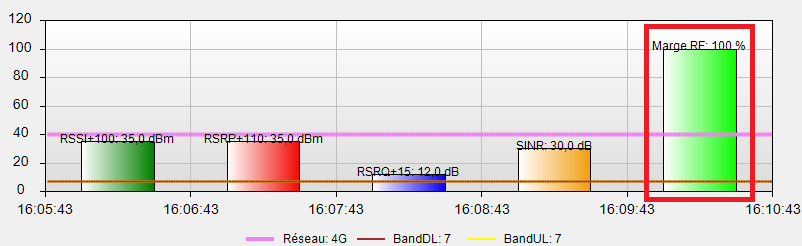
LTE H-Monitor allows you to add personalized indicators from a calculation
formula (based on predefined indicators such as RSSI, flow, ...).
In this example, we will add an indicator called "RF Margin", based on the difference between the RSRP and the RSSI. It will synthesize the quality of the received radio signal.
We will express this indicator as a percentage : the signal will be considered of poor quality (0%) when RSSI-RSRP is greater than or equal to 30dBm, and of very good quality (100%) when this value is less than or equal to 24dBm. For intermediate values, we will apply a rule of 3.
First, we'll calculate our indicator in dBm, and limit it to the [24, 30] dBm range. We will use the formula :
Delta = Min(30, Max(24, Abs(RSRP-RSSI)))
Then we will convert the resulting value to a percentage with the following formula :
Pourcentage = 100*(30-Delta)/(30-24)
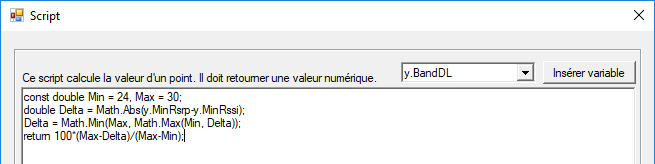
This calculation is performed using a custom script in LTE H-Monitor. The syntax of these scripts is C #. The code we are going to use is :
const double Min = 24, Max = 30;
double Delta = Math.Abs(y.MinRsrp-y.MinRssi);
Delta = Math.Min(Max, Math.Max(Min, Delta));
return 100*(Max-Delta)/(Max-Min);
Then :
- Choose the profile in which you want to display your new indicator (in the rest of this example, it will be :
Vu-Meter) :
- Choose the predefined indicator you want to replace. The
Custom1,
Custom2 and
Custom3 flags are reserved for this use, but since they are already used in this profile, we will be using the RSSI-RSRP flag. It
is important to understand that we could have used any other predefined
indicator, as long as it is not already used in this profile :

- Adjust this indicator as follow :
- Name:
RF Margin - Unit :
% - Format :
N0(To display a value without a decimal point) - Vu-Meter :
2(To display this indicator as a Vu-Meter in the 2nd window. If you prefer to display this indicator as a curve, all you have to do is leave this parameter unchanged and check theVisiblebox)
- Name:
- Click on the
Scriptbutton, and copy/paste the formula we saw above :
- Your indicator should now look like this :

The
Scriptbutton is now blue to indicate that a formula is used for this indicator. - Close the profile configuration screen.
Your new indicator is now displayed :
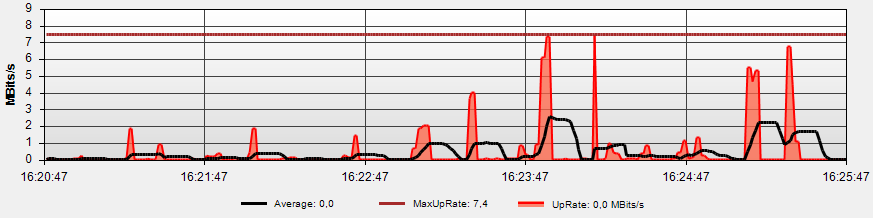
With LTE H-Monitor, you can create customized indicators that perform calculations on all the displayed data. For example, we can calculate a sliding average or display the maximum of a graph :
For this, 2 variables are available in the scripts :
-
Items: This is an array of objects which contains all the displayed points. Each object has the same properties as the objectydisplayed in the drop-down list of variables. The first object in this array (Items[0]) contains the most recent value, and the last (Items[Items.Length-1]) contains the oldest. For example, the variableItems[0].MinRssiwill contain the minimum RSSI value for the most recent point. -
iItem: This is the index in the tableItemsof the point being calculated.
To calculate an indicator that represents the maximum of the downlink transfer speed, we can use the following script :
double Max = Items[0].MaxUpRate;

									for (int i=1; i<Items.Length; i++)

									    Max = Math.Max(Max, Items[i].MaxUpRate);

									return Max;
To display an indicator which represents the sliding average (on 1/25th of the graph) of the downward transfer speed, we can use the following script :
int Depth = Items.Length/25; // Moyenne sur 1/25ème de l'échelle horizontale du graphique

									double Sum = 0;

									int Count = 0;

									for (int i=iItem; i<iItem+Depth && i<Items.Length; i++, Count++)

									    Sum += Items[i].MaxUpRate;

									return Sum/Count;
LTE H-Monitor can export certain data to a TAB-separator text file which can be imported into Excel or other software.
The data that can be exported are :
- Some indicators, such as RSSI, RSRP, RSRQ, SINR, bitrates, number of changes of IP address or BTS over a period. To do this, use the Export function from the graphics menu :
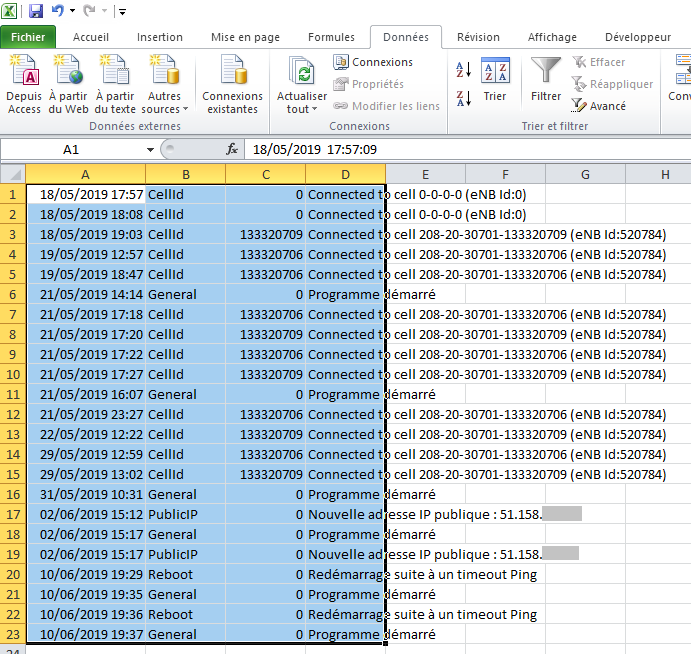
- The history of events. You must use the Export button on the History tab :
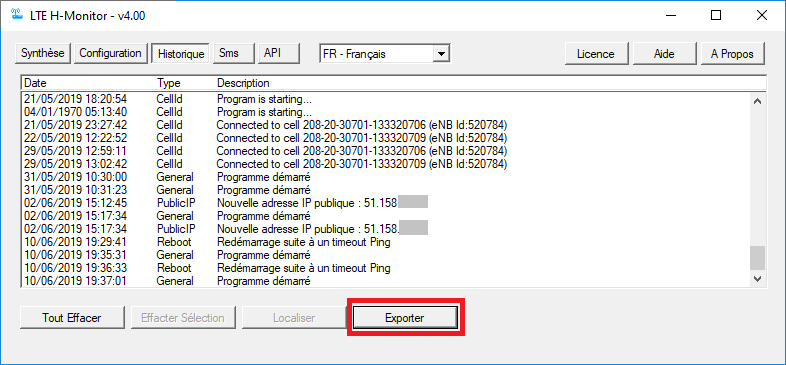
LTE H-Monitor does not export in CSV (Comma Separated Values) format but in TAB-separator format (which is less ambiguous). The file is not saved in .csv but in .txt, otherwise Excel would open it without taking into account the tab separators and without displaying the import screens.
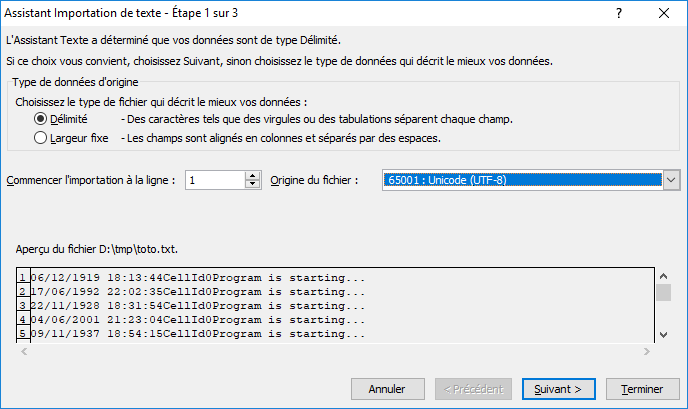
Once the .txt file has been exported, all you have to do is open it in Excel and validate the import screens as follows :
- In the 1st step, select Delimited and specify the UTF-8 origin :
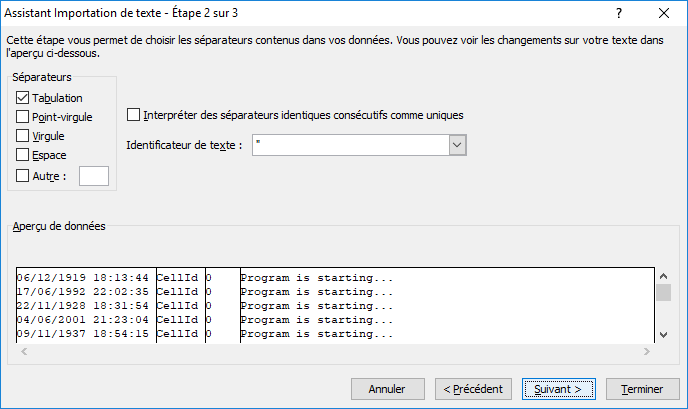
- In step 2, check Tabulation :
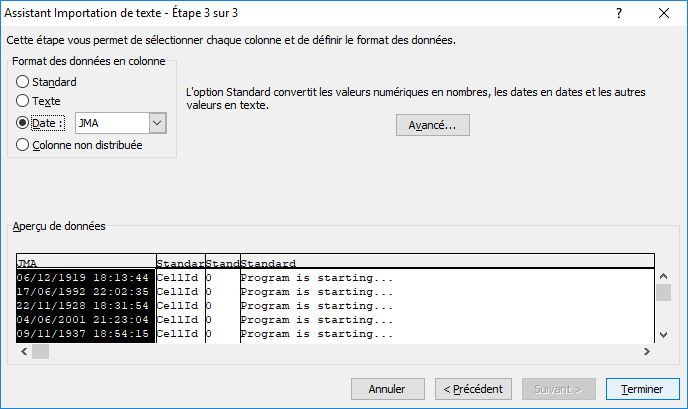
- In the 3rd step, use the DMY format for the 1st column :
The data can then be handled in Excel (Filters, sorts, ...). For example, to display only the IP address changes in the history, all you have to do is create a filter :
-
Select all the data with
Control-A :
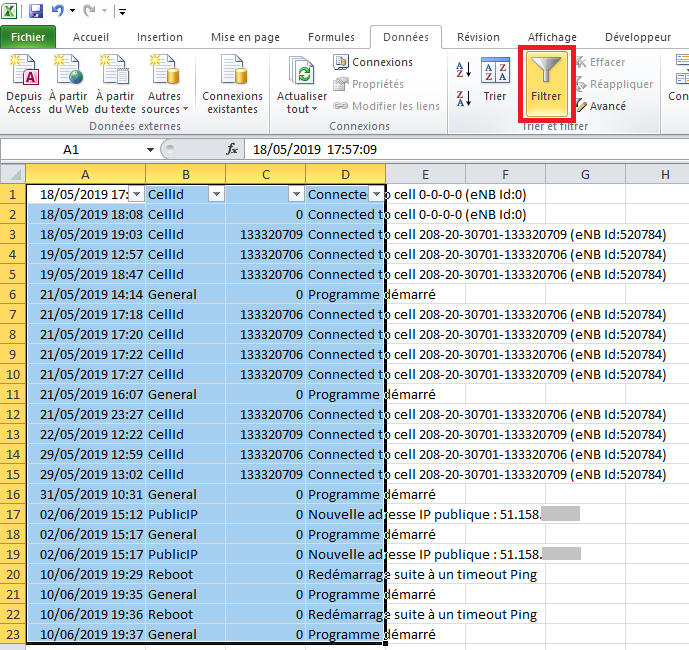
- Then, in the Excel Data menu, choose Filter :
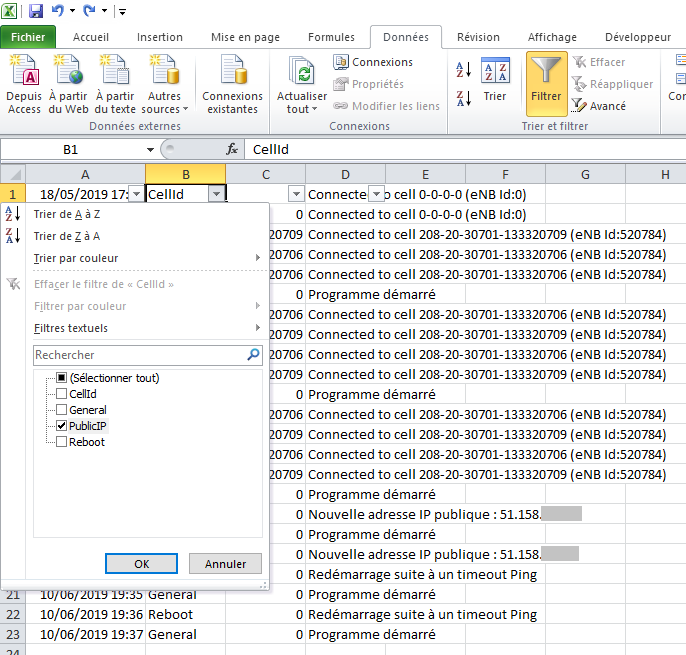
- Then click on the arrow of the column to filter and configure your filter. In our case, this is the 2nd column, and we are going to select only PublicIP, to display only the changes of IP address :
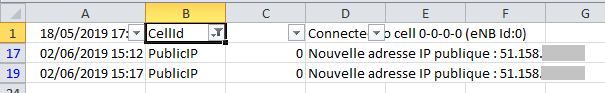
- The result we get is the following one. Only IP address changes are displayed :
The routers' APIs are used to retrieve the indicators (signal quality, bit rates, etc.). They run in low priority on the router : when the processor is busy with a high speed operation (download, Speed Test), they do not respond as quickly... and LTE H-Monitor (or other softwares) therefore cannot obtain and record the indicators. The "embedded" version of LTE H-Monitor does not have this problem because it does not use the same APIs.
When you display the details of the data consumption in Windows, you get a graph like this one, on which LTE H-Monitor seems to consume a lot of data :
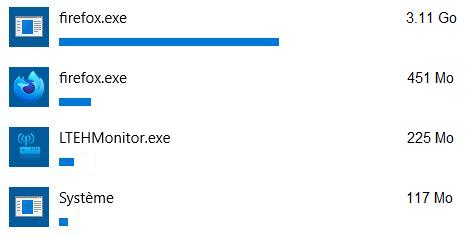
In fact, it is the consumption of data that passes through the network card , and not only the consumption of data on your Internet subscription
To record and display the data, LTE H-Monitor is in permanent communication with the router, on the local network. This is the reason why the data consumption displayed by Windows can be high. But most of this consumption is not done on your Internet subscription : it is done on the local network.
The only data sent or received from the Internet by LTE H-Monitor are as follows :
- Checking for the latest version when starting the software
- Checking the license when clicking on the Save button
- Ping requests at regular intervals when the corresponding option has been enabled ((it is disabled by default)
- DNS queries at regular intervals when the corresponding option has been enabled (it is disabled by default)
- Notifications by EMail when the corresponding option has been enabled.
This represents a relatively small amount of data.
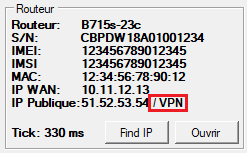
LTE H-Monitor monitors the state of the VPN built into the router. When it is active, the mention VPN is added next to the public IP address of the router :
It is also possible to display a graph to trace the periods when the VPN was active. To do this, you have to use a script with the following formula : return ((y.Flags & 4) != 0) ? 1:0
If you have a Synology NAS, you can run LTE H-Monitor on it in command line (cli) mode. LTE H-Monitor will run all the time, independent of your PC.
To start LTE H-Monitor with the NAS "Task Scheduler", you need a LTE H-Monitor license. Without a license, you can test the operation on the NAS by issuing the commands in a terminal.
For that :
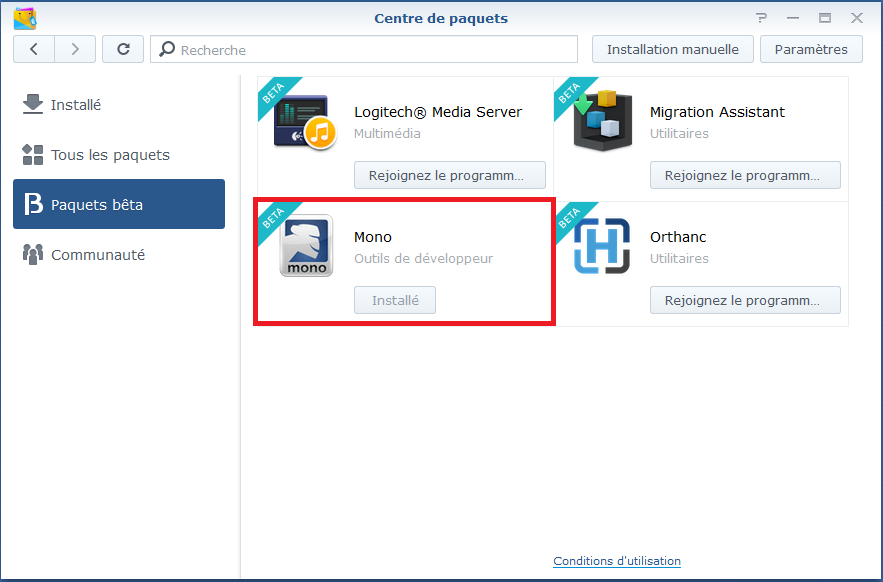
- Open the Synology
Package Center to install
Mono :
-
Install LTE H-Monitor in a shared directory on your Nas. For example, in the
LTEHMonitor directory
of the
Data share
on
volume 1 on the NAS (avoid spaces in the path).
- On Windows, execute LTE H-Monitor in this directory to configure the program, in particular its license. It is also recommended to set a low
automatic save timeout (1 or 2 minutes) so that the data can be consulted quickly.
- Then, go to the configuration panel of the NAS, under the
Task Scheduler section :
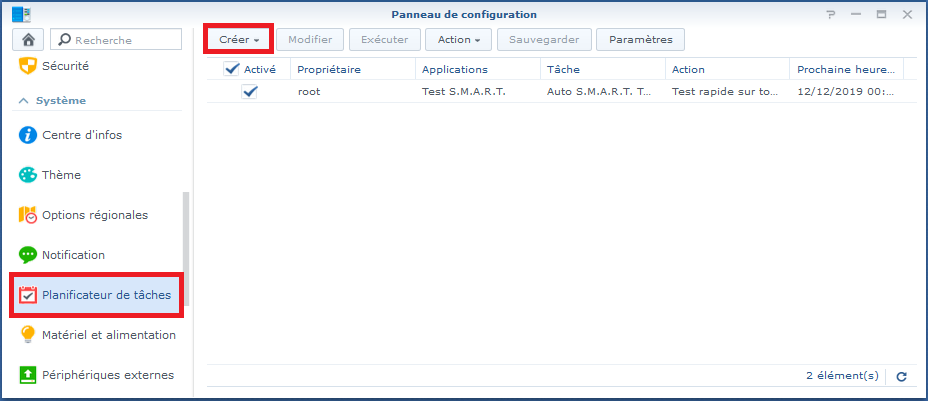
- Click the
Create button
and select "
Triggered Task / User Defined Script".
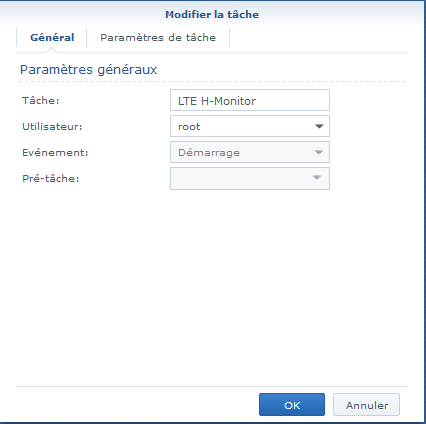
On the screen that appears, specify the general parameters for this new task :- Task : LTE H-Monitor
- User : You can leave root, or specify a user who has read/write permissions in the directory you have chosen. Please note that some functions (such as ping monitoring) need the root user.
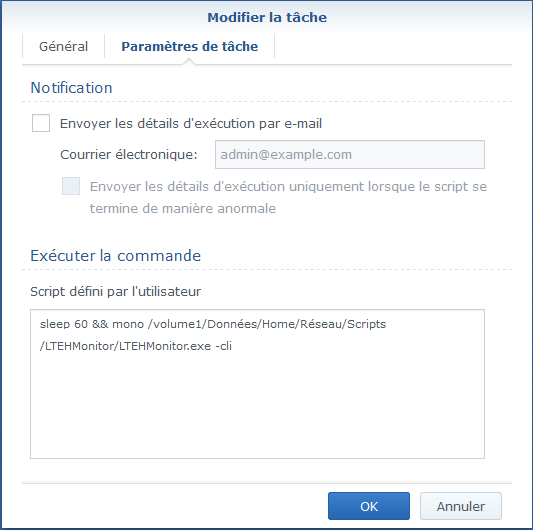
In the Task Settings tab :- Define the following script (on one line) :
sleep 30 && mono /volume1/Données/LTEHMonitor/LTEHMonitor.exe -cli
Make sure to replace the path with the one you have chosen. Watch out for spaces in the LTE H-Monitor path : it is better to avoid them (otherwise, you must add the escape sequences in the command line).
The commandsleep 30at the start is essential to ensure that Mono is available when LTE H-Monitor is executed at NAS startup.
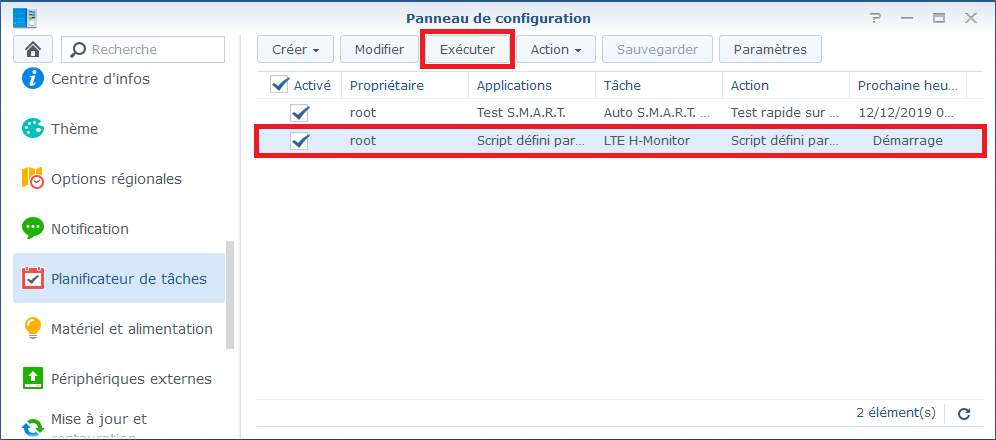
- Once you have validated the creation of the scheduled task, it appears in the list :
- To start LTE H-Monitor, you need to restart your NAS.
- To verify that LTE H-Monitor is running, you can :
- Open the Synology Resource Monitor and check in the Task Manager that the ltehmonitor process is running (you should even find 2 : this is normal)
- Check that the LTEHMonitor.dat file is updated according to the timeout you have set for automatic backups.
- If you want to stop LTE H-Monitor, use one of these methods :
- Disable the scheduled task and restart your NAS
- or connect to your NAS with SSH and run the following command :
sudo pkill -SIGINT ltehmonitor - Disable the scheduled task and restart your NAS
- To display the data recorded by LTE H-Monitor, all you have to do is open the executable under Windows, from the shared folder in which you have installed the program.
If you have a Synology NAS, you can send SMS notifications with LTE H-Monitor.
For that :
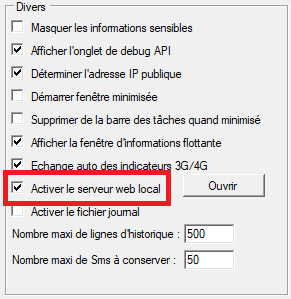
- Activate the LTE H-Monitor web server by checking the corresponding box in the Configuration tab :
- Check that the sending of SMS by LTE H-Monitor is working. Just use the following URL in your browser :
http://LTEHMonitorAddress:8080/sms/send.aspx?tel=XXXXXXXXXX&message=Hello World
Of course, it is necessary to replace :
- LTEHMonitorAddress by the IP address of the machine running LTE H-Monitor
- XXXXXXXXXXby the SMS recipient number
- Then, go to the NAS configuration panel, under Notifications :
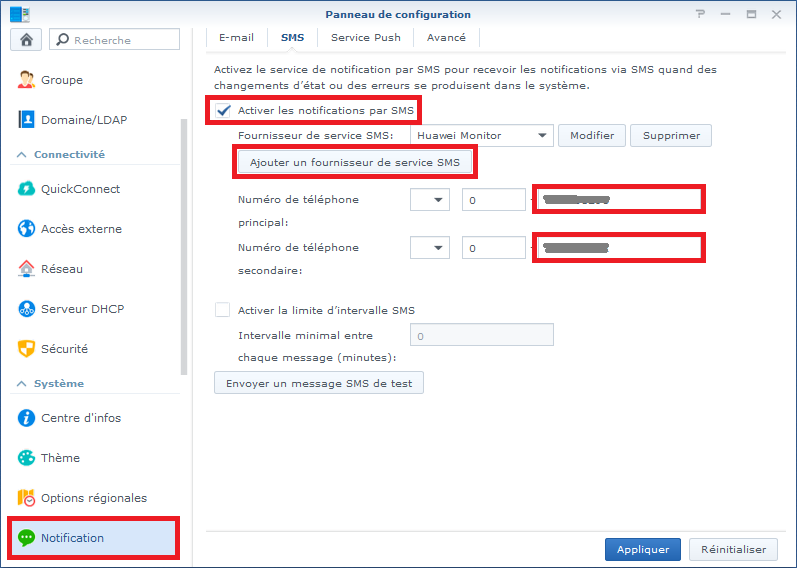
- The first thing to do on the NAS is to add an SMS service provider by clicking on the corresponding button. The parameters to be used are as follows :
- Name of provider : LTE H-Monitor
-
SMS URL :
http://LTEHMonitor
Address:8080/sms/send.aspx?tel=&message=Hello World
by replacing AdresseLTEHMonitor by the IP address of the machine on which LTE H-Monitor is running. The rest of the URL should not be changed.
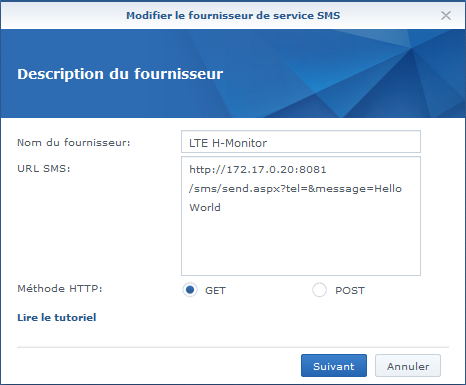
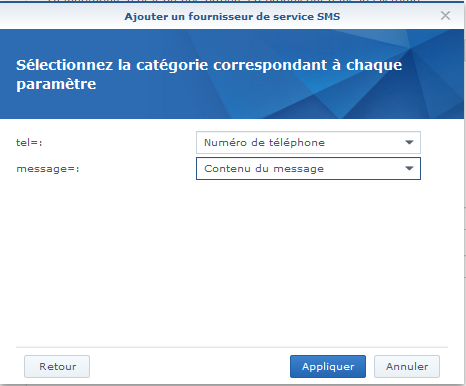
On the next screen, there is nothing to change.
On the last screen, you have to specify that :- The tel parameter is the 'Phone number'
- The message parameter is the 'Message content'
- Once the SMS provider has been created, all you have to do is define the phone number(s) to use.
- Finally, you can test the sending of SMS by your NAS by clicking on the button 'Send a test message'.
Attention, you need at least version 2.70 of LTE H-Monitor.
LTE H-Monitor does not collect any personal data, any geolocation of the
machine or the router on which it operates, no usage statistics.
The only external connections made by LTE H-Monitor are :
- During the registration procedure ( License window), a unique identifier linked to the router to which it is connected is sent. This identifier does not contain any personal information. In particular, it does not make it possible to know the serial number of the router or its location. This identifier is just used to create a license for the software in order to activate all its functions.
- When it is started, LTE H-Monitor checks if a new version is available. If so, a message is displayed.
- When using the
Locate
function
(cell or IP - by clicking on the corresponding buttons on the home screen
)
, the software sends the selected service (Google Map, Cartoradio,
etc.) the cell information and / or the IP address to display the
requested information. If you do not want this information to be
transmitted, simply do not use these functions.
- When using PING or DNS monitoring functions, a regular connection is made to the configured addresses, according to the configured time interval. If you do not want these connections to be made, just do not use these functions (this is the default configuration).
- When using email notifications, a connection is made to the specified email server. If you do not want this connection to be made, just do not use this function.
- When using the network tools.